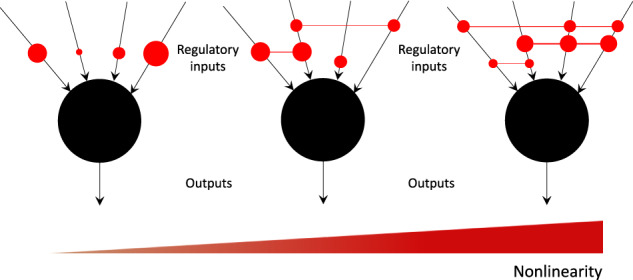
Fig. 1. An illustration of the concept of regulatory nonlinearity.

Each black circle represents a generic biochemical component such as a gene, transcription factor, enzyme, etc., regulated by a set of inputs (also biochemical components) and generates a generic output such as concentration level, strength, etc. Non-zero interactions among the inputs are represented by red circles connected by red lines, with the total number of possible interactions for a node with k inputs equal to . The size of the red circles and the width of the connecting lines represents the weight of the interactions. Independent inputs are represented by unconnected red circles. The degree of nonlinearity would thus be expected to increase, though not necessarily linearly, from left to right, as the numbers and the strengths of the regulatory interactions increase. One could also visualize these local interactions in a broader network-context as “hypergraphs”46.
