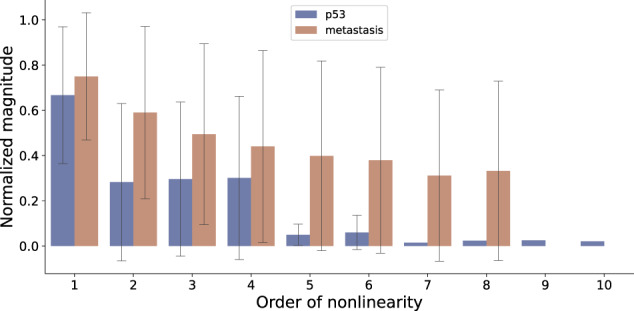
Fig. 4. A comparison of the spectrums of the magnitudes of nonlinearity of the models corresponding to the two extreme cases of approximability.

The bars represent the mean absolute value of all the Taylor derivatives of the corresponding order, averaged over all the nodes of the corresponding model containing those terms. The maximum orders (in-degrees) of P53 and Metastasis are respectively 10 and 8. To compare the derivatives from different models they were normalized with respect to the maximum possible absolute value of a Taylor derivative of order ∣α∣ (Eq. (6)) of a Boolean function with output bias p, given by (proof provided in the “Methods” section). The error bars represent the standard deviation and not the confidence intervals of the means since they are not estimates. The errors appear large whenever the corresponding distribution of the magnitudes are bimodal with many values clustered close to 0.
