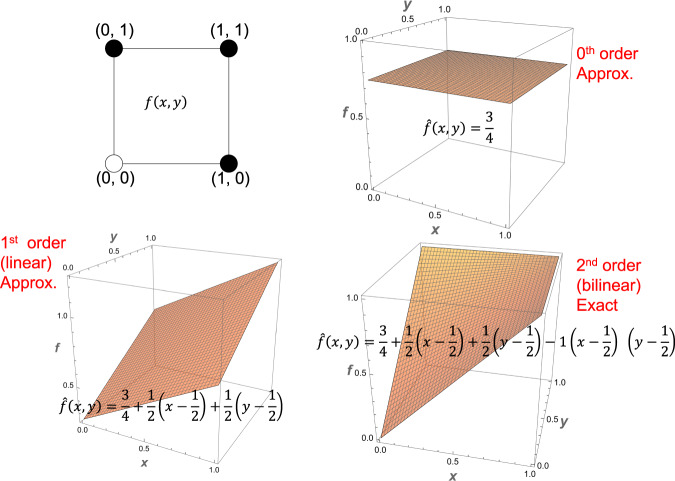
Fig. 5. The various approximations of a Boolean function in increasing order of nonlinearity.
The logical OR function is represented as a 2D hypercube (top left) with the coordinate values representing input combinations and the color of the circles representing the corresponding outputs (white = 0, black = 1) and is approximated using Taylor decomposition as the 0th order approximation (top right) showing only the first term, the mean output bias; the 1st order approximation (bottom left) including the linear terms; and finally the 2nd order exact form (bottom right) including all the terms.

