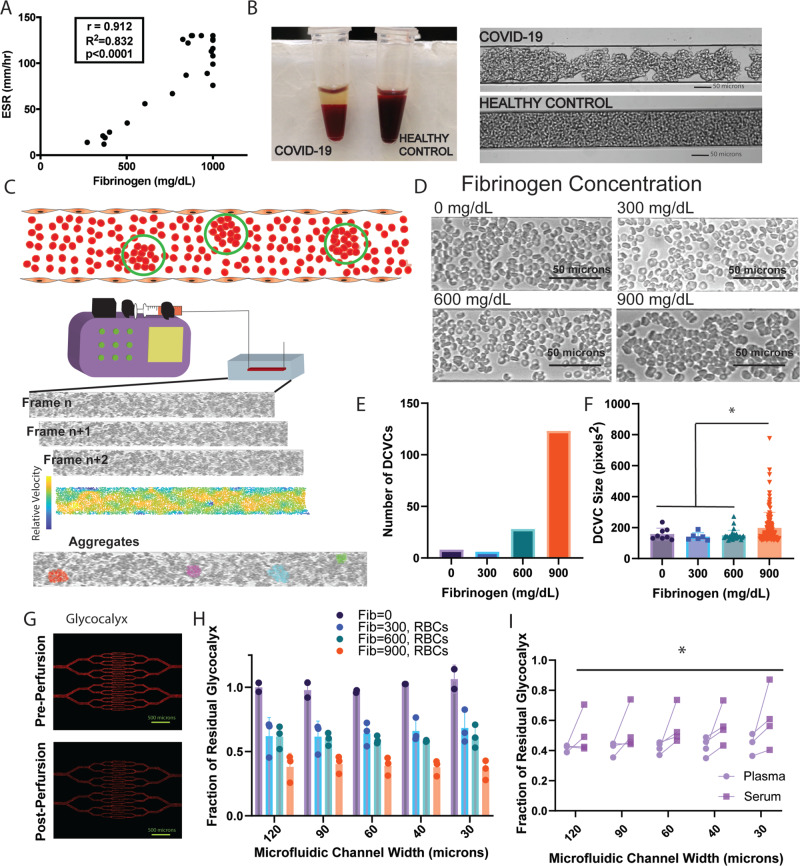
Fig. 2. Fibrinogen mediates RBC aggregation and biophysically induces endothelial cell damage.
A Positive correlation between ESR and fibrinogen levels in COVID-19 patients (p < 0.0001 via Pearson linear regression). B (Left) COVID-19 patient blood shows rapid sedimentation on the benchtop and (Right) aggregation in a microfluidics channel under static conditions compared with healthy control. C (Top) Cartoon demonstrating RBC aggregation detected using our velocity field calculations and the differential cell velocity cluster (DCVC) identification. (Bottom) Experimental setup of RBC perfusion into the microfluidics device with a representative time series of frames obtained via video microscopy. Below is a relative velocity map for tracked cell edges with identification of clusters via our criteria for RBC DCVC calculations. D Frames from video microscopy at four fibrinogen concentrations showing a qualitative increase in RBC aggregation with increasing fibrinogen. E Exponential increase in the number of detected DCVCs with increasing fibrinogen level as compared to minimal amount of aggregation seen at a fibrinogen concentration of 0 mg/dL or at the physiologic level of 300 mg/dL. F Increase in the mean DCVC size with increasing fibrinogen concentration. A size of 115 square pixels is approximately 15 RBCs (*indicates a significant difference in DCVC size via unpaired two-tail t-test with Welch’s correction, p < 0.05; 900 mg/dL vs 0 mg/dL p = 0.029, vs 300 mg/dL p = 0.0010, vs 600 mg/dL p < 0.0001). G Endothelial glycocalyx in serially branching microvasculature-on-chip devices stained with fluorescently tagged wheat germ agglutin before (top) and after (bottom) perfusion of RBCs. H Average fraction of residual glycocalyx detected in the microfluidics devices from (G) at each of the tested fibrinogen levels for n = 3 experiments. Significant decrease in residual glycocalyx with increasing fibrinogen level via two-way ANOVA (p = 0.002). I Measurement of glycocalyx degradation induced by paired plasma and sera (i.e. recalcified fibrinogen-decreased plasma) samples from (n = 4) COVID + patients. Pooled results across all channel sizes show a significantly greater degree of glycocalyx degradation in plasma versus sera samples (*p = 0.0006 via paired t-test). Unless otherwise indicated, all values are displayed as mean + /- SD. Source data are provided as a Source Data file.

