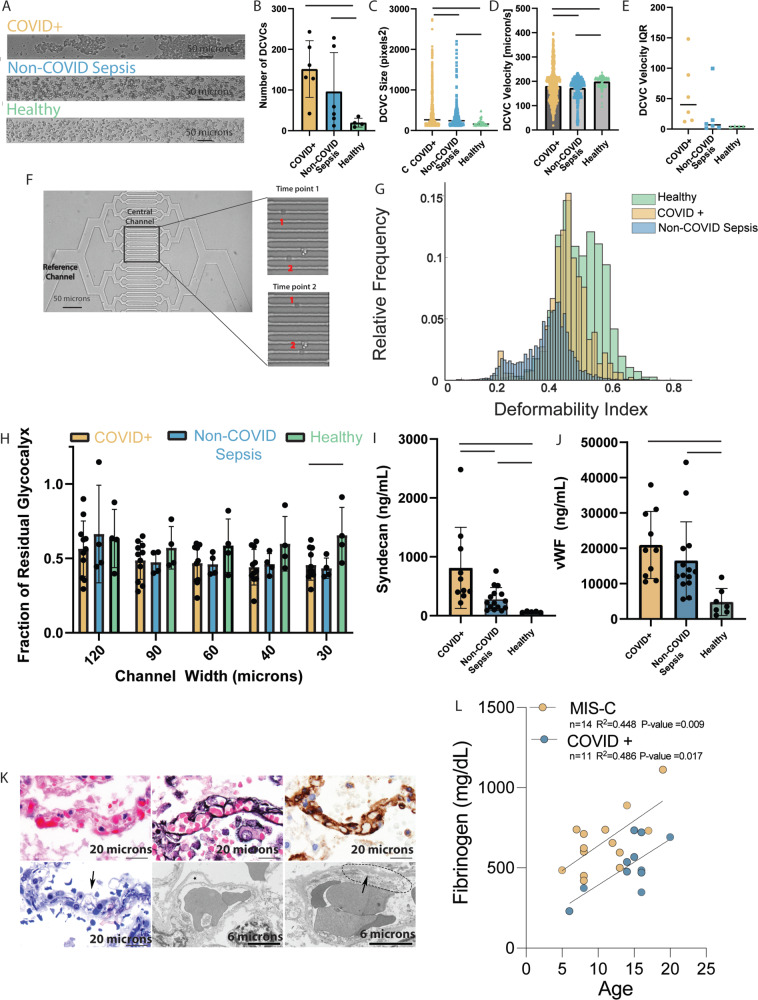
Fig. 3. Plasma from both COVID + and non-COVID sepsis patients results in endothelial glycocalyx damage but from different mechanisms.
Unless otherwise indicated, statistical evaluation was via two tailed t-test, solid bar indicates p < 0.05, and data are reported as mean +/− SD. A Video microscopy frame showing the RBCs under shear combined with COVID + (top), non-COVID sepsis (middle), or healthy volunteer (bottom) plasma. B Increased DCVCs detected with COVID + (n = 6) and non-COVID sepsis (n = 6) compared with healthy volunteer plasma (n = 4, p = 0.0115 and p = 0.0217). C Mean DCVC size in COVID + patients (n = 743) was greater compared with non-COVID sepsis (n = 360, p < 0.0001), and healthy volunteers (n = 57, p = 0.0004) D Average velocity of the DCVCs was similar among all groups; however, there was a significant difference in the variance of pooled measurements by two-tailed t-test with COVID + demonstrating the largest variance. E The DCVC velocity IQR of COVID + patients is larger than non-COVID sepsis or healthy controls. F (Top left) Two RBCs cross the central channels of deformability assay. G Normalized histogram of pooled single-cell deformability indices demonstrating that COVID + RBCs are less deformable than healthy controls, but more than non-COVID sepsis. H Plasma from COVID + (n = 11, p = 0.018) and non-COVID sepsis (n = 4, p = 0.067) patients induces greater glycocalyx damage in the smallest microfluidics channel compared with healthy volunteers (n = 4). I COVID + (n = 11) patients have increased syndecan-1 versus non-COVID sepsis (n = 15, p = 0.0094) and healthy volunteers (n = 5, p = 0.0334); non-COVID sepsis vs heathy (p = 0.0244). J COVID + and non-COVID sepsis patients have increased levels of vWF compared with healthy controls (n = 5, p = 0.0007 and p = 0.0135 respectively), no significant difference between the two patient populations (p = 0.316) K Pulmonary capillaries in COVID-19 patients examined post-mortem. Light microscopy (top left), with clogging by erythrocytes and scant fibrin. Jones (top middle) and CD34 (top right) stains show intact basement membrane and endothelial lining. Semi-thin sections for ultrastructural examination (bottom left) show endothelial injury (arrow) characterized by cell swelling and disruption. Transmission electron microscopy (bottom middle, bottom right) shows endothelial cell dehiscence from basement membrane (star) and loss of structural integrity (dotted line) with feathering of the basement membrane (arrow). Representative images from one of 6 COVID-19 decedents analyzed with similar results. L Strong correlation (via Pearson correlation coefficient) between maximum fibrinogen level during hospital admission and age in both COVID + pediatric (p = 0.017) and MIS-C patients (p = 0.009). Source data are provided as a Source Data file.

