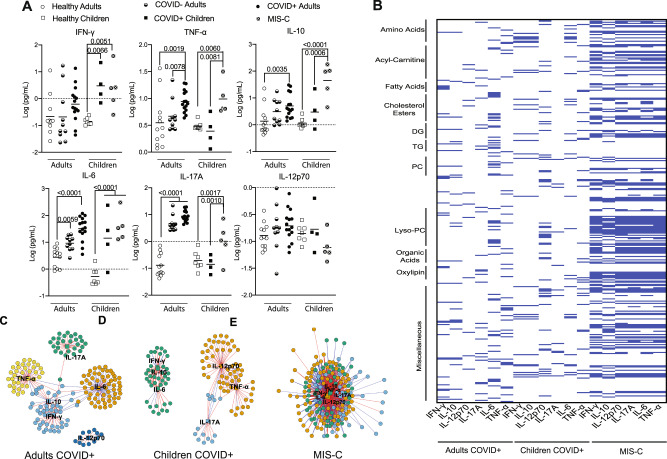
Fig. 6. Comparison of cytokine responses in COVID + adults, COVID + children or children with MIS-C.
A Plasma levels of cytokines present in various cohorts indicated. Both COVID + children (n = 4) and children with MIS-C (n = 5) present with a different cytokine profile compared to healthy children (n = 7). COVID + adults (n = 15) have the highest increase in these cytokines followed by severely ill COVID– adults (n = 10) and healthy controls (n = 12), (one-way ANOVA, p-value shown above). B Comparison of cytokines with analytes identified by multiomics studies further demonstrates distinct pathogenesis of COVID-19 in adults as compared to pediatric patients (Supplementary Datasets 7 and 8). C–E Network analysis of the metabolites that correlate with cytokines in COVID + adults (C), COVID + children (D) or children with MIS-C (E). Network plots were generated using a centrality cut-off determined by xmWAS97. Information for these plots is provided in the Supplementary Information (Supplementary Datasets 7–10). Source data are provided as a Source Data file.

