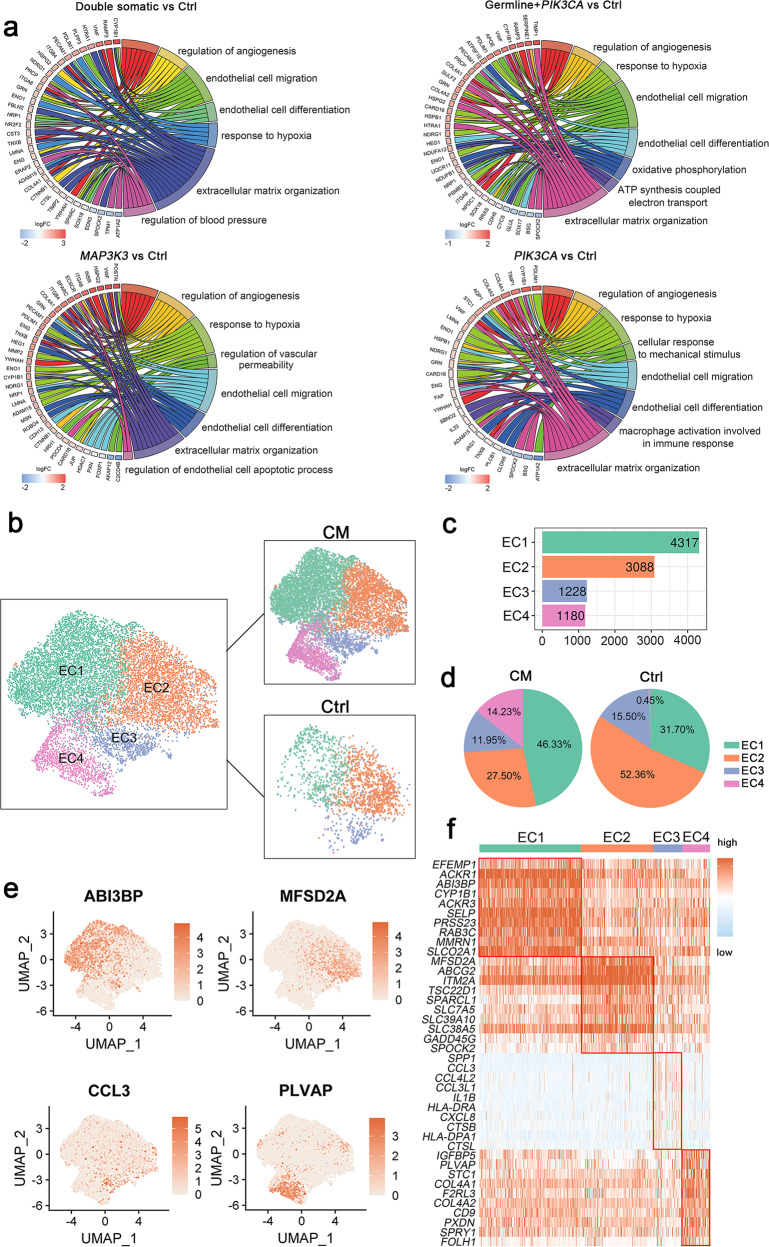
Fig. 2. Endothelial cell clusters.
a GO and Kyoto Encyclopedia of Genes and Genomes (KEGG) pathway enrichment analyses of differentially expressed genes (DEGs) in ECs between CM samples with different genetic mutations and control samples, shown in chord plots. b UMAP plot for the distributions of four EC subclusters in control and CM samples. CM, twelve CM samples; Ctrl, three control samples. c Cell numbers of four EC subclusters. d Pie plots for the cell number percentages of four EC subclusters in the control and CM groups. e Marker genes of four EC subclusters shown with UMAP plots. f Top ten differentially expressed genes (DEGs) in four EC subclusters.

