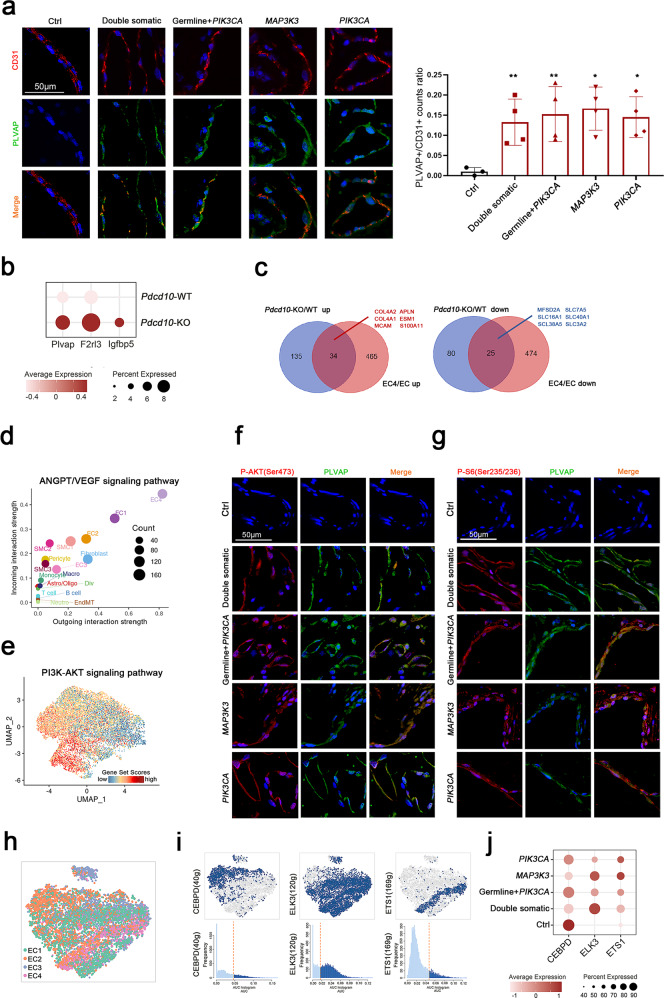
Fig. 3. PLVAP-positive EC subcluster.
a Immunofluorescence staining indicating the coexpression of CD31 (red) and PLVAP (green) in different groups. Scale bars, 50 µm. PLVAP + /CD31 + count ratio quantified with NIH ImageJ software (mean ± SD). There were no significant differences among the four mutation groups (one-way ANOVA), comparisons between each mutation group and the control group (Student’s t test), *P < 0.05, **P < 0.01. b Dot plot for EC4 subcluster marker genes (Plvap, F2rl3, Igfbp5) derived from the reanalysis of the publicly available single-cell dataset (GSE155788)13 comparing Pdcd10-KO and Pdcd10-WT brain ECs. c Venn diagrams representing the intersection between the significant differentially upregulated (left panel) or downregulated (right panel) genes in Pdcd10-KO vs. Pdcd10-WT brain ECs (blue circles) and the EC4 subcluster vs. all ECs (pink circles). The upregulated genes are written in red, and the downregulated genes are written in blue. d Scatter plot showing outgoing (x-axis) and incoming (y-axis) cellular interaction strength of ANGPT and VEGF signaling pathways in all cell types. e The distributions of the PI3K-AKT signaling pathway in four EC subclusters. Immunofluorescence staining indicating the coexpression of (f) P-AKT (Ser473) (red) or (g) P-S6 (Ser235/236) (red) with PLVAP (green) in different groups. DAPI-stained nuclei are shown in blue. Scale bars, 50 µm. h SCENIC-based tSNE plot for the distributions of four EC subclusters. i SCENIC analysis predicted transcription factors such as CEBPD, ELK3, and ETS1 as specific hubs governing the states of corresponding EC subclusters (top). Transcription factor regulon activities were quantified using AUCell (bottom). j Expression of CEBPD, ELK3, and ETS1 in different groups in all ECs, shown in a dot plot.

