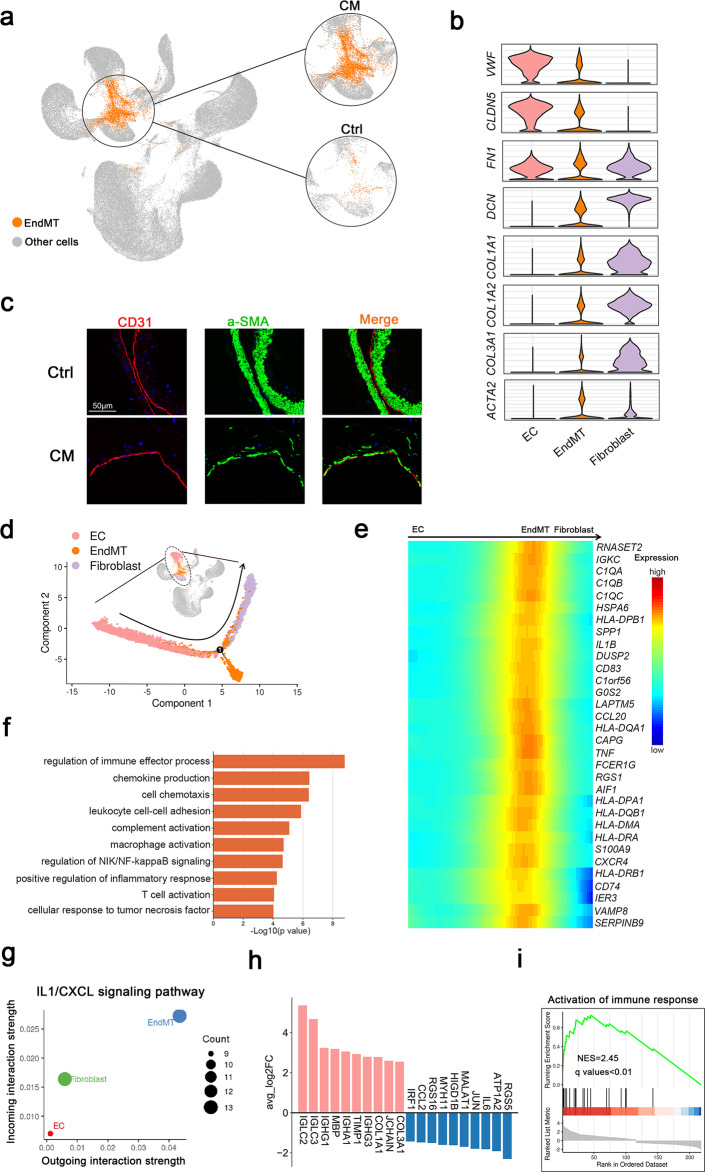
Fig. 4. Endothelial-to-mesenchymal transition cell cluster.
a UMAP plot for EndMT and other cells (left panel) divided into control and CM groups (right panel). b Marker genes of ECs, EndMT cells and fibroblasts shown in violin plots. c Immunofluorescence staining of EndMT markers (CD31 and a-SMA) in the control and CM groups. CD31, red; a-SMA, green and DAPI-stained nuclei shown in blue. Scale bars, 50 µm. d Monocle 2 pseudotime analysis for ECs, EndMT cells and fibroblasts. e Heatmap showing the expression of dynamic immune genes along the pseudotime axis and a bar plot for Gene Ontology (GO) enrichment analysis of these genes (f). g Scatter plot showing outgoing (x-axis) and incoming (y-axis) cellular interaction strength of IL1 and CXCL signaling pathways in ECs, EndMT cells, and fibroblasts. h Top ten differentially expressed genes (DEGs) upregulated (pink, avg_log2FC ≥ 0.25 and P value < 0.05) or downregulated (blue, avg_log2FC ≤ -0.25 and P value < 0.05) in lesion EndMT cells. i Gene set enrichment analysis (GSEA) indicating the enrichment of immune activation in lesion EndMT cells based on the Molecular Signatures Database (http://www.gsea-msigdb.org/gsea/index.jsp).

