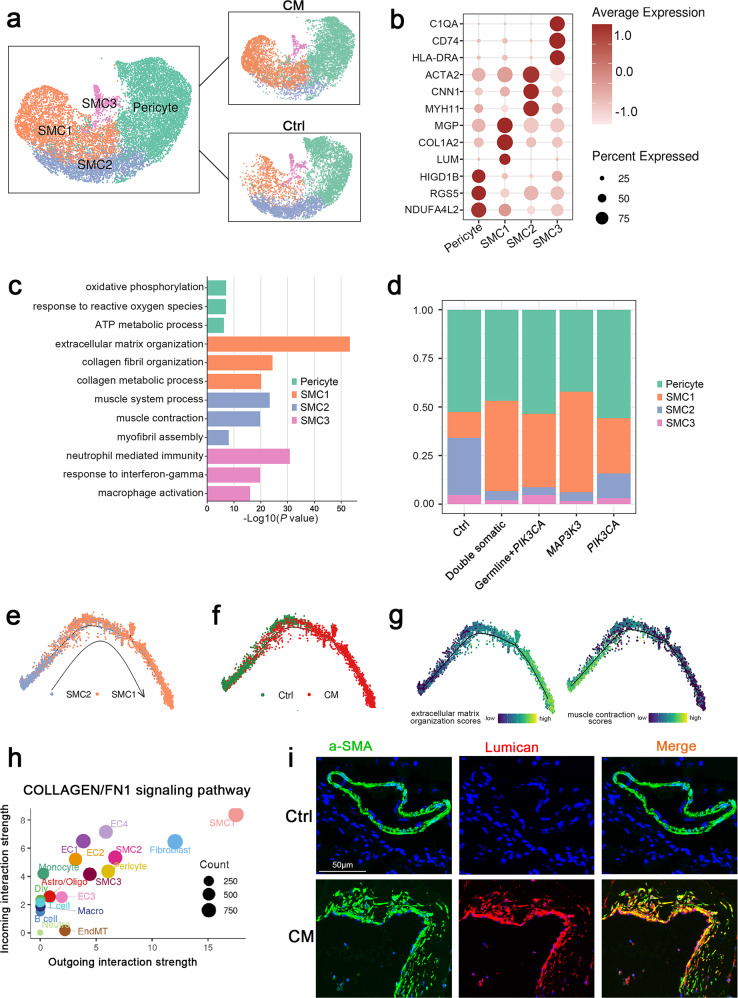
Fig. 6. Mural cell clusters.
a UMAP plot for the distributions of four mural cell subclusters (left panel) divided by control and CM groups (right panel). b Marker genes of four mural cell subclusters. c GO enrichment analysis of DEGs in four mural cell subclusters. d The proportions of the four mural cell subclusters in the different groups. Monocle 2 pseudotime analysis for SMC1 and SMC2 marked with cell types (e), control and CMs groups (f). g Extracellular matrix organization and muscle contraction scores along the pseudotime axis. Specific genes are shown in Supplementary Table 4. h Scatter plot showing outgoing (x-axis) and incoming (y-axis) cellular interaction strength of COLLAGEN and FN1 signaling pathways in all cell types. i Immunofluorescence staining of SMC1 marked by a-SMA and lumican in (b) in the control and CM groups. Lumican, red; a-SMA, green and DAPI-stained nuclei shown in blue. Scale bars, 50 µm.

