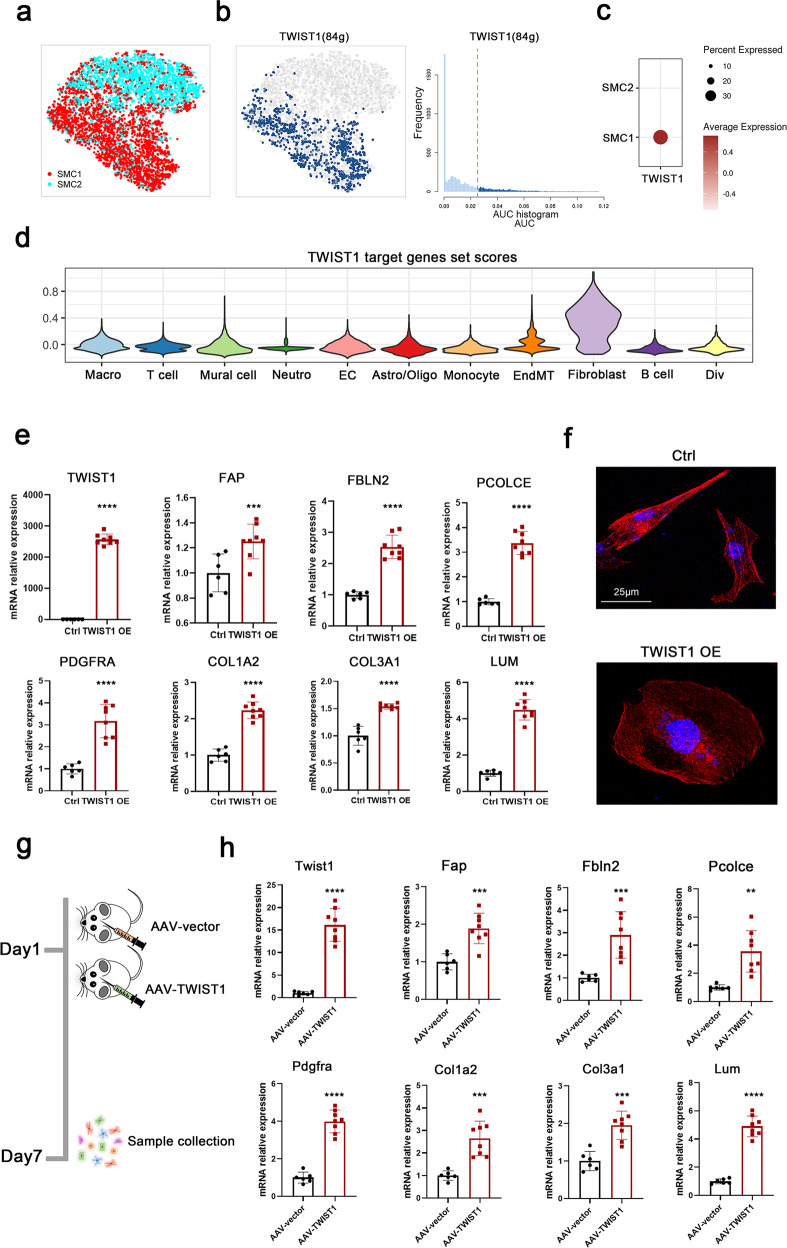
Fig. 7. TWIST1 induced phenotypic switching of SMCs.
a SCENIC-based tSNE plot for the distributions of SMC1 and SMC2. b SCENIC analysis predicted the transcription factor TWIST1 as a specific hub distinguished from SMC2 governing SMC1 cell states (left panel). TWIST1 regulon activities were quantified using AUCell (right panel). c Dot plot for TWIST1 expression in SMC1 and SMC2. d TWIST1 target gene set scores in 11 cell types. Specific genes are shown in Supplementary Table 5. e Expression levels of TWIST1 and SMC phenotypic switching markers analyzed via RT‒qPCR assay in HASMCs after TWIST1 and control plasmid transfection. f Morphological changes and cytoskeletal reorganization of HASMCs are shown by rhodamine-phalloidin staining (red) in the TWIST1 overexpression and control groups. DAPI-stained nuclei are shown in blue. Scale bars, 25 µm. g TWIST1 overexpression in SMCs of mice was induced by stereotaxic injection of AAV-SPI1 with the SM22a promoter into the basal ganglia. Primary cerebrovascular SMCs were collected 7 days after AAV-TWIST1 and AAV-vector injection. h Expression levels of Twist1 and SMC phenotypic switching markers analyzed via RT‒qPCR assay in primary SMCs of cerebrovascular after AAV-TWIST1 and AAV-vector injection. Primary SMCs were isolated following the standard procedure of the MicroBeads kit and then used for RNA extraction and RT‒qPCR assay without culturing. Data are represented as the mean ± SD (AAV-vector group, n = 6; AAV-TWIST1 group, n = 8). Statistics were performed using Student’s t test, and significance was determined as **P < 0.01, ***P < 0.001, ****P < 0.0001.

