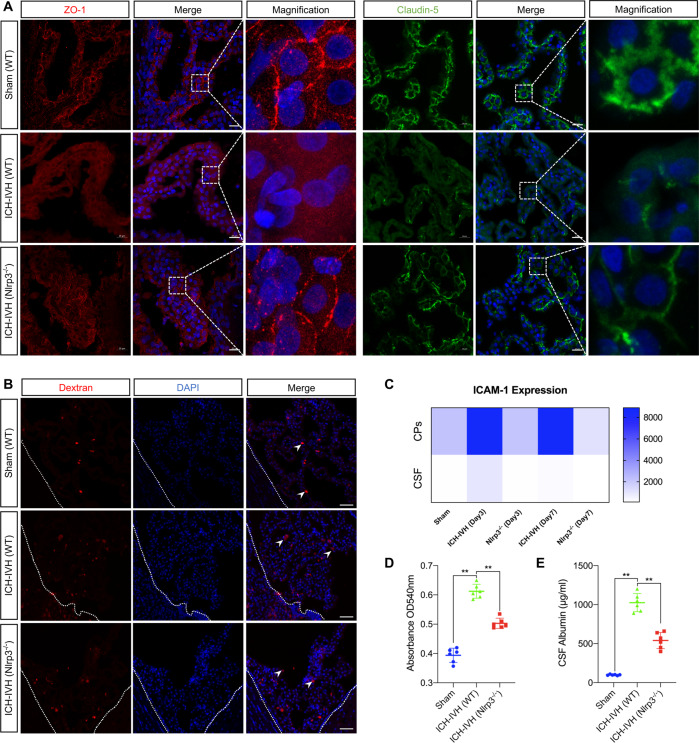
Fig. 3. Assessment of B-CSFB integrity in WT rats and Nlrp3−/− rats 3 days after ICH-IVH.
A Representative images of immunofluorescence staining for ZO-1 and claudin-5 in the choroid plexus of different groups. Scale bar = 20 μm. B Pictures of B-CSFB leakage assessed by dextran. Scale bar = 50 μm. C Heatmap of ICAM-1 expression in the choroid plexus and CSF (n = 3, one-way ANOVA). D Results of the absorbance assay of CAFs in different groups after dextran injection (n = 3, one-way ANOVA). E Statistical results of CSF albumin content in different groups (n = 6, one-way ANOVA). The results are expressed as the mean ± SD, **P < 0.01.

