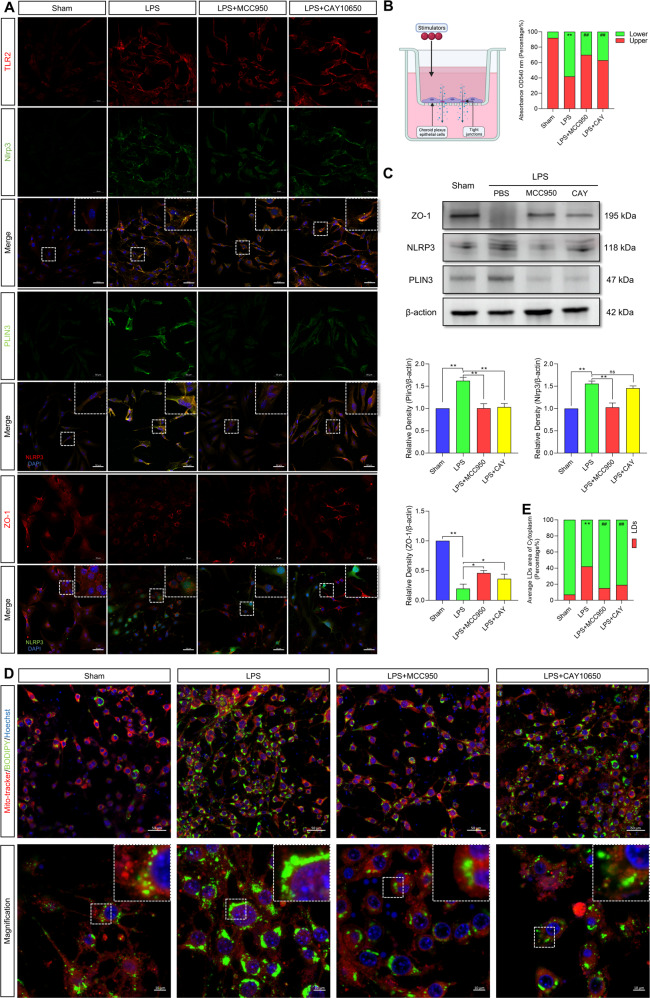
Fig. 7. LPS induces NLRP3 activation in CPECs and disrupts tight junctions by regulating LD formation.
A Immunofluorescence multiple-localization staining results of TLR2, NLRP3, PLIN3 and ZO-1 in CPECs under LPS stimulation and MCC950 or CAY10650 treatment. Scale bar = 50 μm. B Barrier function assessment in a CPEC-composed B-CSFB as measured by dextran leakage (n =3, one-way ANOVA). C The expression of ZO-1, NLRP3 and PLIN3 in LPS-induced CPECs and MCC950 or CAY10650 treatment (n = 3, one-way ANOVA). D Images of LDs stained with BODIPY and mitochondria labeled with MitoTracker. Scale bar = 50 μm (upper), Scale bar = 10 μm (lower). E Results of LD coverage area of cells (n = 3, one-way ANOVA). The results are expressed as the mean ± SD, **P < 0.01, *P < 0.05, ns P > 0.05.

