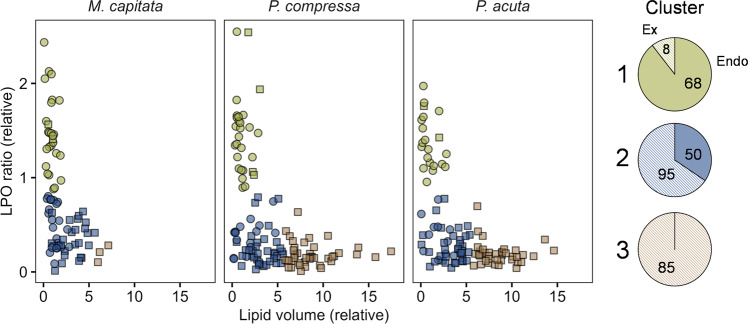
Fig. 2. Scatterplot of LPO ratio versus lipid content relative to the mean value of endosymbiotic cells in individual coral endosymbiotic and ex-symbiotic algal cells from three species of corals (as in Fig. 1).
Plot colours indicate groups identified via Kmeans clustering (green: cluster 1 ‘endosymbiotic’; blue: cluster 2 ‘transition’; orange: cluster 3 ‘ex-symbiotic’). Shapes indicate cell type (circle: endosymbiotic, square: ex-symbiotic). Circle diagrams show proportion of endosymbiotic (endo) vs ex-symbiotic (ex) algal cells within each cluster; numbers indicate total count of cells of each cell type.

