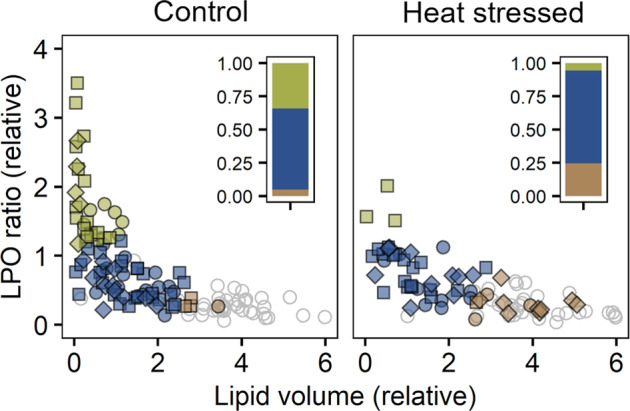
Fig. 3. Scatterplots of LPO ratio versus lipid volume relative to the mean value of endosymbiotic cells in individual coral endosymbiotic and ex-symbiotic algal cells from control and heat-treated colonies of Pocillopora acuta (n = 3).

Shapes indicate colony replicate. Raw data from Nielsen et al. [33]. Clusters identified and coloured as for Fig. 2. Only endosymbiotic cells are coloured, with ex-symbiotic cells shown as grey, open symbols. Bar graphs show the proportion of endosymbiotic cells in each cluster.
