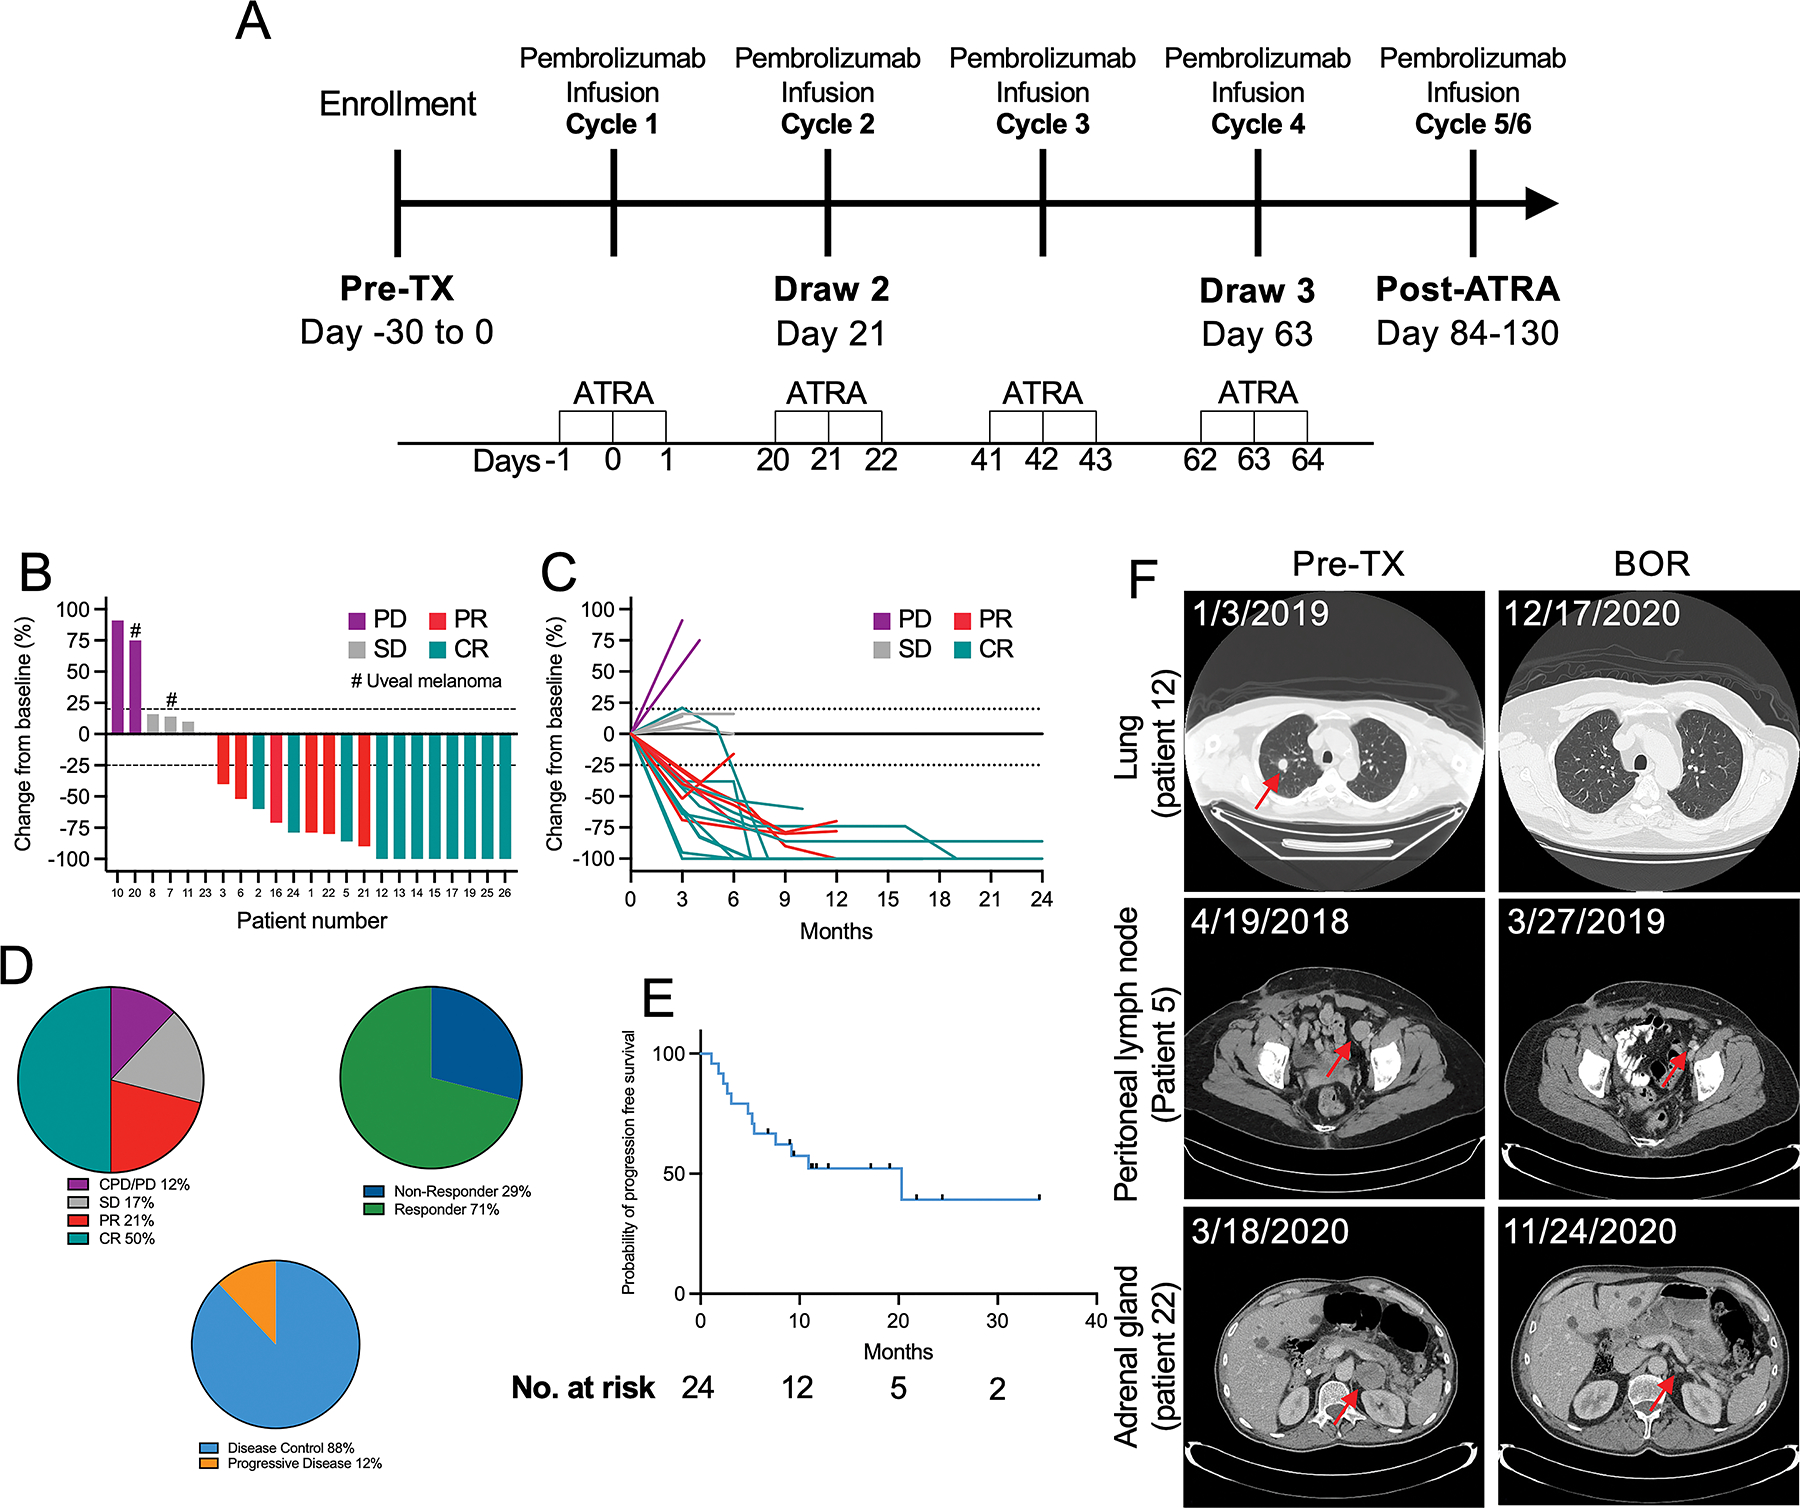
Figure 1. Clinical trial design and efficacy measures.

(A) Schematic depiction of the treatment and correlative sample collection schedule implemented in this clinical trial. (B) Waterfall plot depicting best overall responses (BOR) according to RECIST v1.1 criteria. (C) Spider plot depicting changes in target lesion size over time. (D) Comparisons of best of overall response, overall response rate, and disease control rate. (E) Survival curve showing the probability of progression free survival analyzed using the Kaplan-Meyer method, with data censored at first sign of progression, death, or last known follow-up. (F) Representative images from computerized tomography (CT) scans showing responses in the labeled organs.
