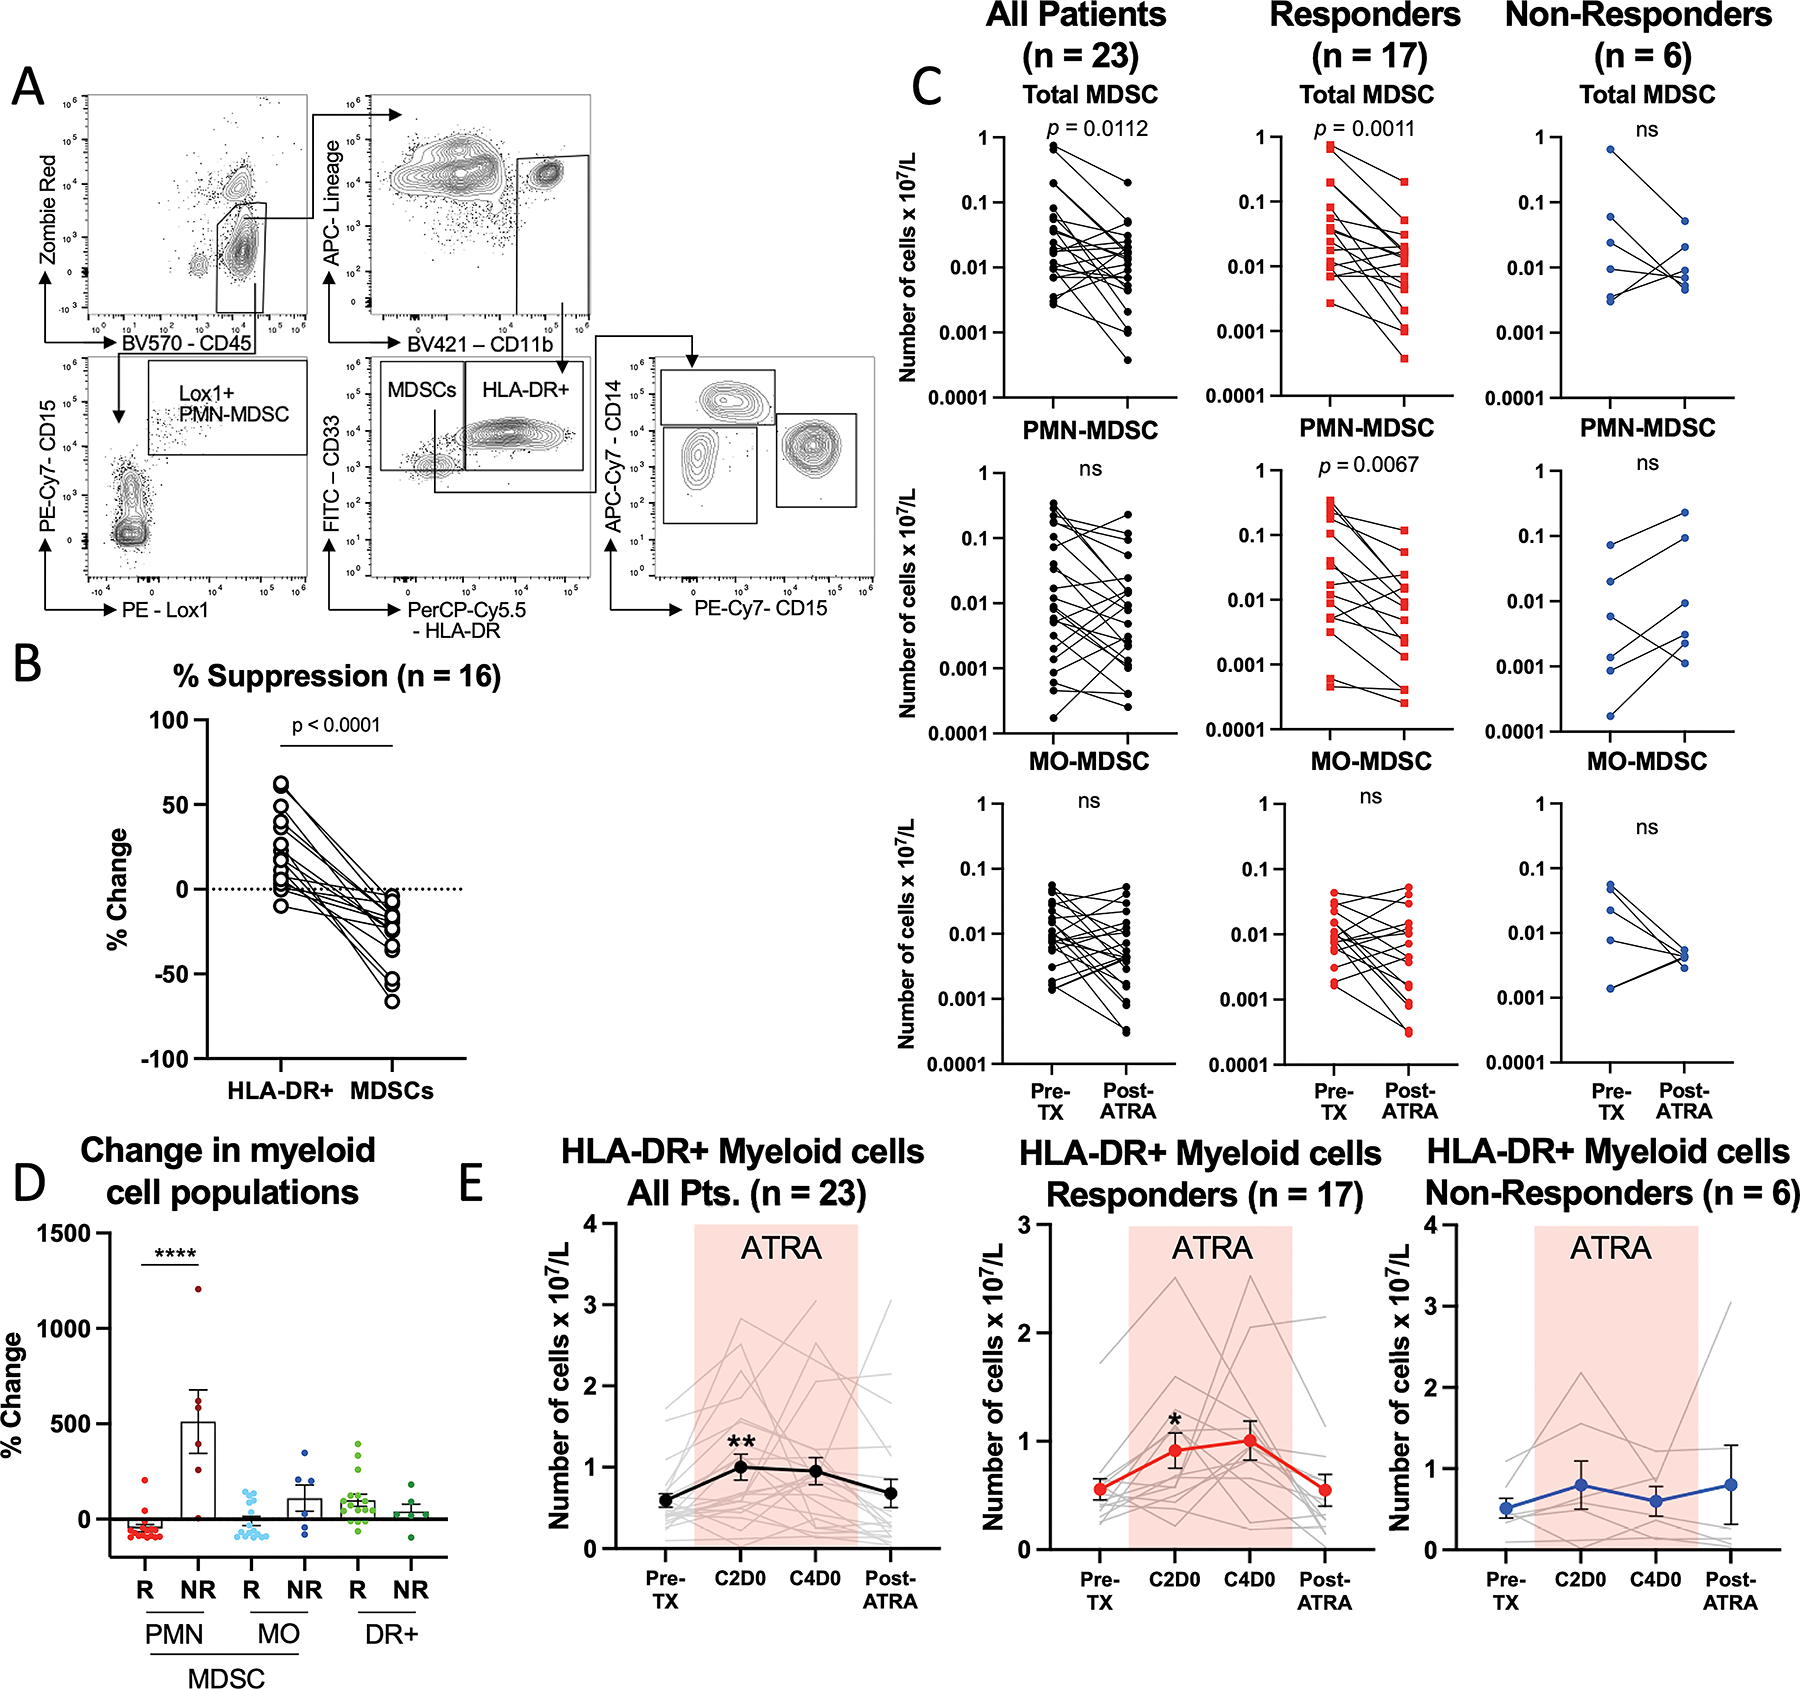
Figure 2. The combination of ATRA and pembrolizumab decreases the number of circulating PMN-MDSCs.

(A) Representative flow cytometric gating strategy to identify and quantify circulating MDSC subsets. (B) The suppressive function of MDSCs depicted as a percent change in T cell proliferation from T cells stimulated with anti-CD3/CD28 comparing HLA-DR+ myeloid cells (DR+) to MDSCs. Connecting lines indicate paired analysis from each patient. (C) Comparisons of the number of circulating MDSC subsets in pre-treatment (pre-TX) and post-ATRA blood samples, from all patients (pts), responding (R) patients, and non-responding (NR) patients. Connecting lines indicate paired analysis from each patient. (D) Summary of the percent change from pre- to post-ATRA timepoints in myeloid cell populations. (E) Comparisons of number of circulating HLA-DR+ mature myeloid cells in all patients (pts), responding (R) patients, and non-responding (NR) patients. Colored box denotes the time when the patients were being treated with ATRA. * Denotes p < 0.05, ** p < 0.01, *** p < 0.001. Cycle 2 Day 0 (C2D0), Cycle 4 Day 0 (C4D0).
