
Figure 1. Assessment on overall model calibration.
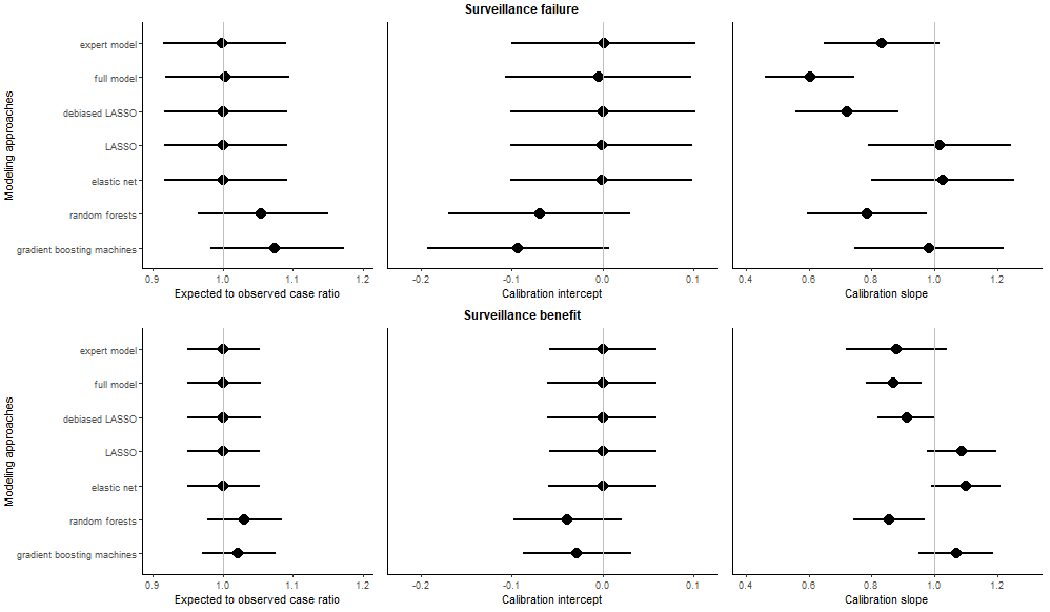
We showed the overall model calibration measured by three metrics, including the ratio of expected to observed events (E/O ratio) and calibration intercept and slope for surveillance failure (interval cancer; top panel) and benefit (surveillance-detected cancer; button panel) for each prediction modeling approach. The 95% CI for each calibration measure was shown using the error bars. The vertical lines showed the ideal value for each metric (1 for E/O ratio, 0 for calibration intercept, and 1 for calibration slope).