
Figure 2. Weak calibration for 7 risk prediction models for surveillance failure (interval second breast cancer).
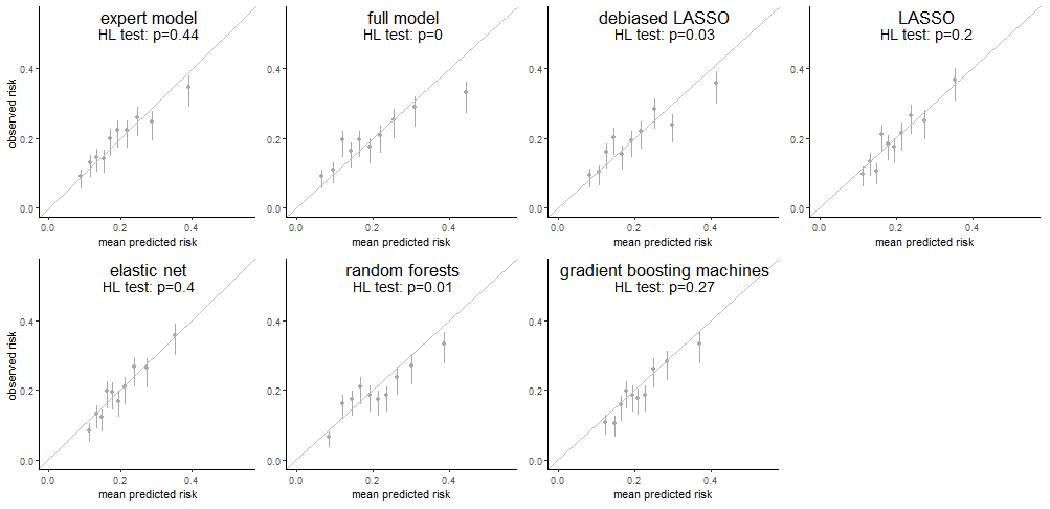
Each subfigure demonstrated the weak calibration of an individual modeling approach by comparing the mean predicted risk (x-axis) to the observed risk of surveillance failure (y-axis) in 10 deciles determined by the predicted risk. The vertical error bars showed the 95% confidence interval of the observed risk of surveillance failure in individual deciles. A p-value from the Hosmer-Lemeshow test (HL test) was shown as well for each modeling approach.