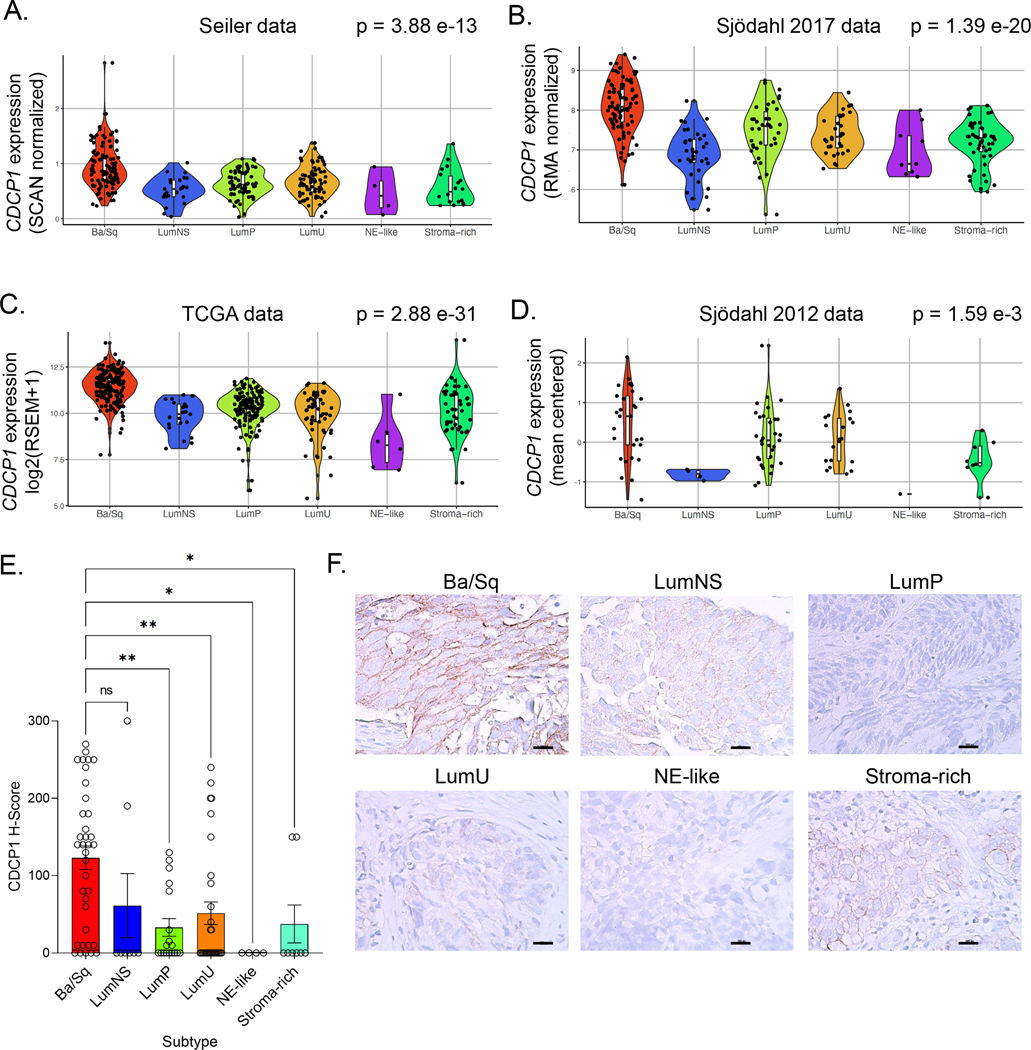
Figure 1. CDCP1 expression across the consensus molecular subtypes of MIBC.
A-D. Violin plots showing CDCP1 mRNA expression levels by consensus molecular subtypes in the TCGA, Seiler 2017, Sjödahl 2017, and Sjödahl 2012 cohorts. The p values from ANOVA testing for each cohort are shown, and p values from Kruskal-Wallis testing and pairwise comparisons using the Wilcoxon rank-sum test are shown in Supplemental Table 1. E. H-scores quantifying CDCP1 expression from primary bladder cancer biopsies. The biopsies are organized according to consensus subtype. F. Representative IHC images showing the membranous staining of CDCP1 in bladder cancer biopsies.

