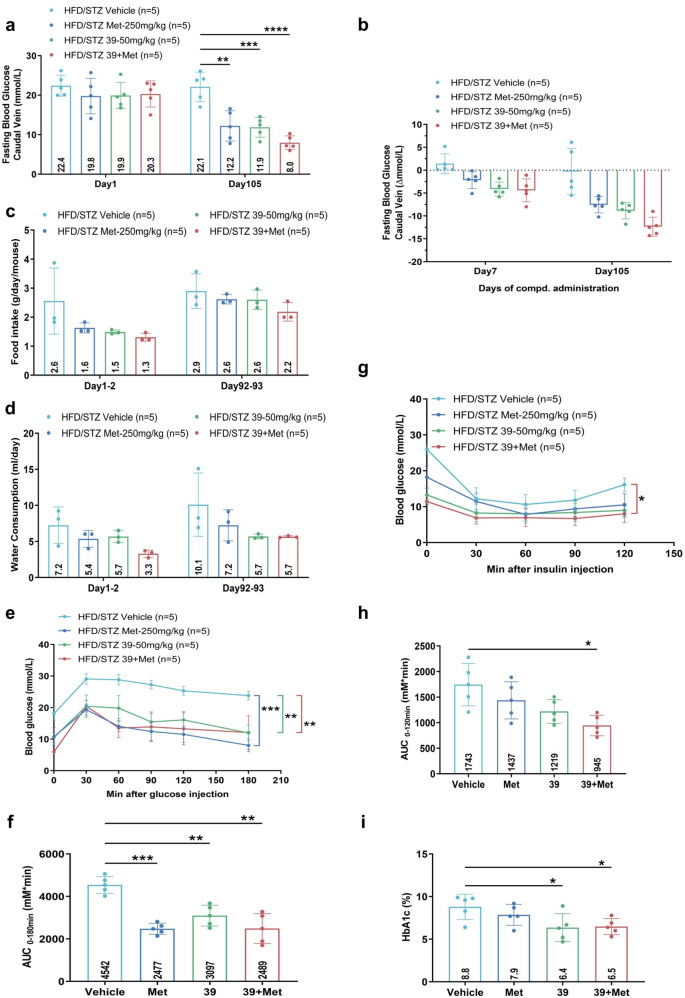
Fig. 6.
Combination of IHMT-MST1-39 and metformin decreases hyperglycemia progression in HFD/STZ-induced mouse model of T2D. a–d Fasting blood glucose (caudal vein), food intake and water consumption measurements for once a week. e, f Intra-peritoneal glucose tolerance test (IPGTT) performed during 0 min and 180 min after glucose injection. Respective area-under-the-curve (AUC) shown in f. g, h Intra-peritoneal insulin tolerance test (IPITT) performed during 0 min and 120 min post insulin injection. Respective area-under-the-curve (AUC) shown in h. i HbA1c level was measured by Chemray-240/800. Data were expressed ±SEM. *p < 0.05, IHMT-MST1-39 compared with vehicle group mice; P values determined by Student’s t test

