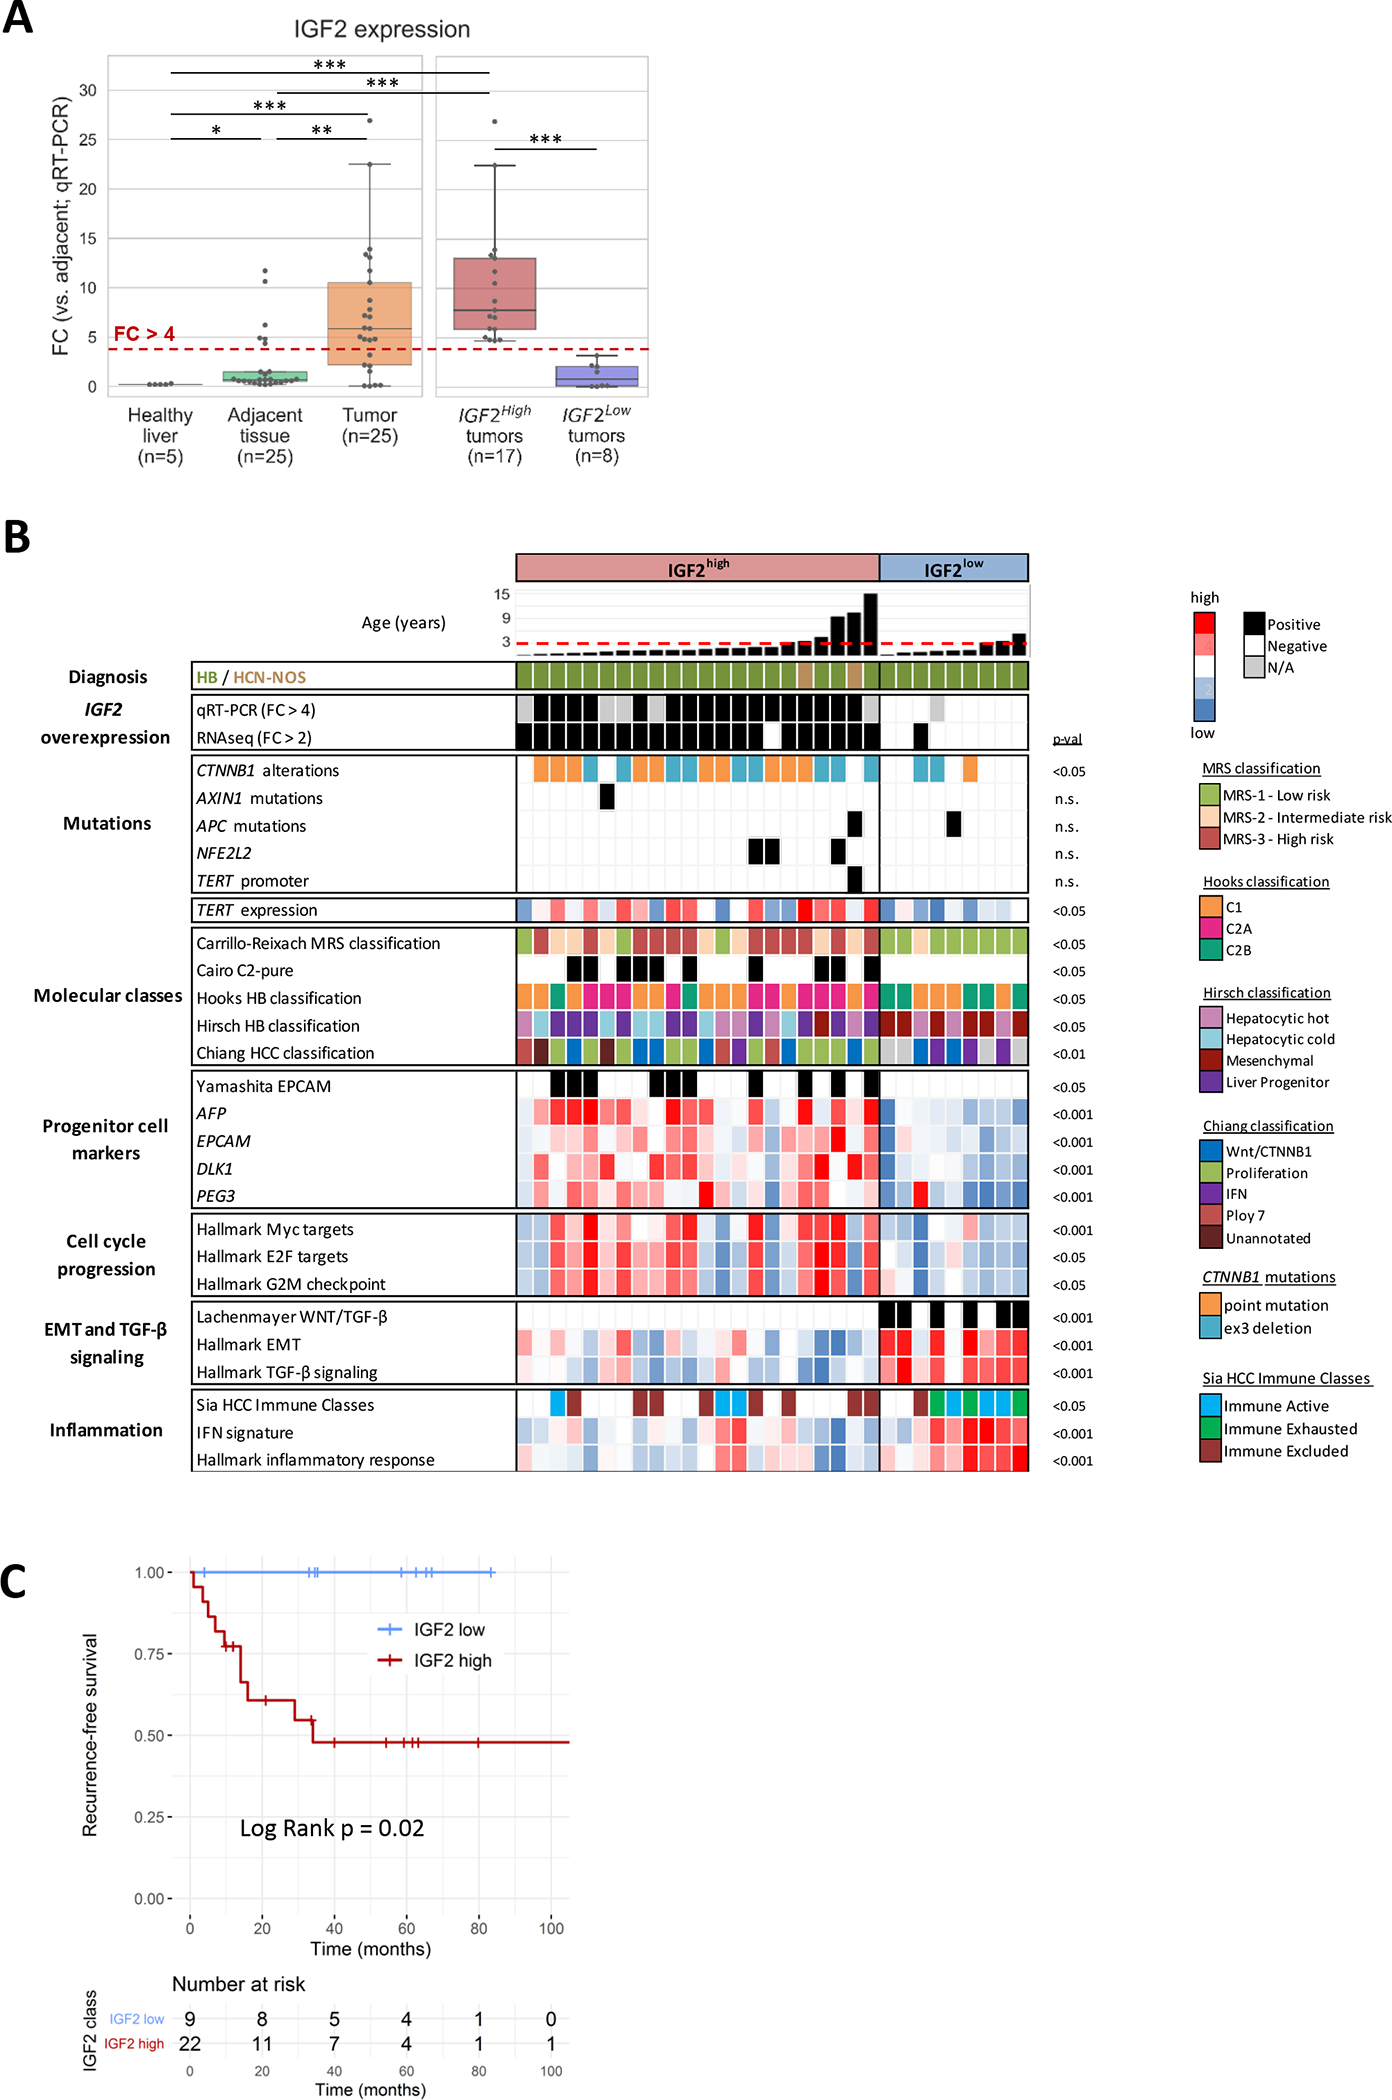
Figure 1. Characterization of IGF2high HB tumors.

(A) IGF2 expression levels determined by quantitative RT-PCR in healthy liver, adjacent non-tumoral liver tissue and HB tumor samples (left). HB tumor samples classified as IGF2high and IGF2low (right). *p < 0.05, **p < 0.01, ***p < 0.001. (B) Molecular profile of IGF2high and IGF2low HB tumors. IGF2 expression levels were determined by RNA-seq and qRT-PCR. IGF2high was defined as fold-change (FC) > 4 versus mean adjacent non-tumoral tissue for qRT-PCR; and as FC > 2 versus median adjacent non-tumoral tissue for RNA-seq. The dashed red line marks the age of 3 years. HB: hepatoblastoma. HCN-NOS: Hepatocellular Malignant Neoplasm, Not Otherwise Specified. Statistical tests: t test and Fisher. Displayed p values were obtained comparing IGF2high and IGF2low HBs. (C) Kaplan-Meier’s plots for recurrence-free survival of IGF2high (n=9) and IGF2low (n=22) HB patients. Statistical test: log Rank.
