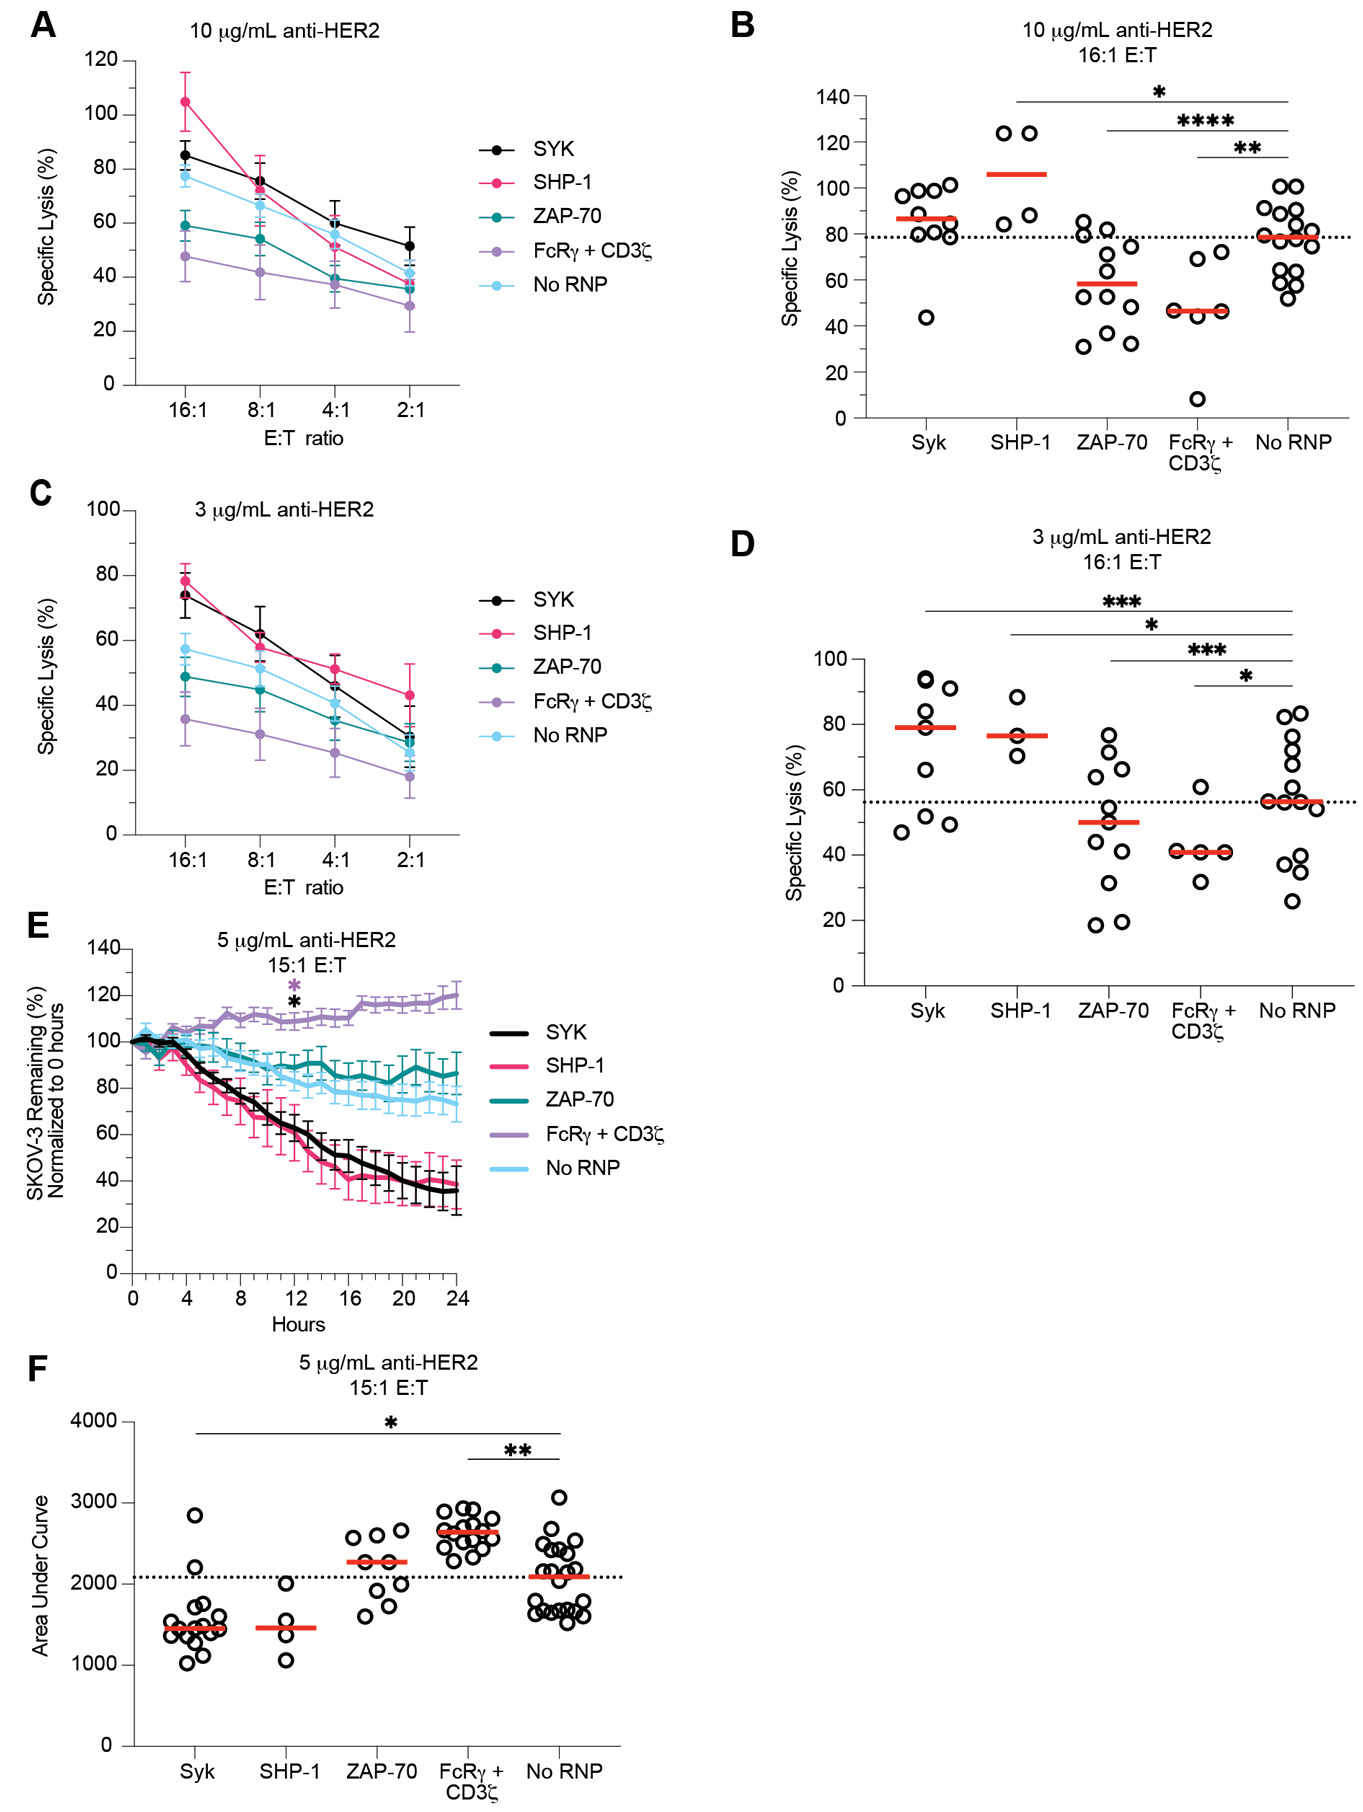
Figure 5. SYK and SHP-1 ablation increases NK cell killing.

SYK-, SHP-1-, ZAP-70-, and FcRγ/CD3ζ-ablated expanded primary NK cells were used in DELFIA and Incucyte killing assays six days post-CRISPR/Cas9. DELFIA assays were run by combining NK cells with opsonized SKOV-3 cells. SKOV-3 cells were opsonized with 10 μg/mL (A) and 3 μg/mL (C) anti-HER2, then incubated with NK cells at various E:T ratios. Specific lysis values from both 10 μg/mL (B) and 3 μg/mL (D) samples tested at the 16:1 E:T ratios were plotted. For Incucyte killing assays, NLR-SKOV-3 cells were opsonized with 5 μg/mL anti-HER2 and incubated with expanded primary NK cells at an E:T ratio of about 15:1. Wells were imaged every hour to quantify the percentage of SKOV-3 cells remaining from the original count (E). For each subject, the area under the SKOV-3 % remaining curve was calculated (F). Lines indicate the mean, whereas error bars represent SE (A, C, E). Dots represent individual subjects, whereas red lines represent the median (B, D, F). Data from 7 independent experiments. Dunnet’s multiple comparison’s test for mixed effects model (B, D-F). For E, the cumulative area under the curve was calculated for each subject and group at each timepoint, then compared to the No RNP group. Position of the star indicates the first timepoint that differences became statistically significant, and the color of star indicates the group that was significantly different (E). Numerical values indicate p values for samples with 0.1 > p > 0.05. *: p < 0.05; **: p < 0.01; ***: p < 0.005; ****: p < 0.001. Lack of stars indicates non-significance.
