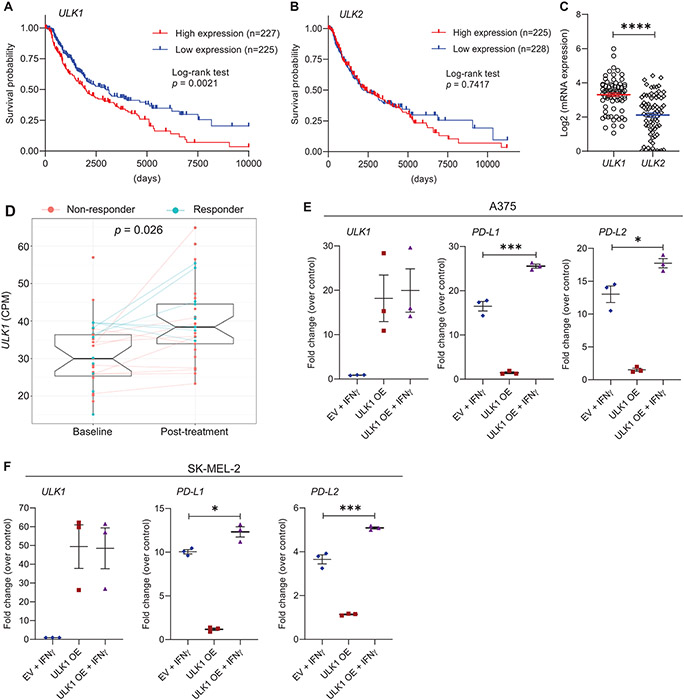
Figure 1. Overexpression of ULK1 correlates with poor survival in melanoma patients and increased expression of IFNγ-induced immunosuppressive genes in melanoma cells.
(A-B) Kaplan–Meier survival plots show survival probability for melanoma patients with (A) high (n = 227) versus low (n = 225) expression levels of ULK1 (cut-point 17.17) and (B) high (n = 225) versus low (n = 228) expression levels of ULK2 (cut-point 15.95). Data were extracted from the GDC TCGA Melanoma (SKCM) dataset using the UCSC Xena browser (https://xena.ucsc.edu/). Statistical analyses were performed using Log-rank test and p values are shown. (C) Scatter dot plot with means ± SEM shows Log2 of mRNA expression of ULK1 and ULK2 in melanoma cell lines measured by RNA-sequencing (n = 77, Expression 22Q1 Public). Data were extracted from DepMap Portal (https://depmap.org/portal/). Statistical analysis was performed using two-sample two-tailed t test. ****, p < 0.0001. (D) Differential expression analysis of ULK1 in melanoma patient biopsies prior and post anti-PD-1 therapy (dbGaP study accession: phs001919.v1.p1). Box-plots show counts per million (CPM) of ULK1 expression, on average 30.7 (± 9.17 SD) for 27 patients prior to treatment (baseline) and 39.6 (± 10.18 SD) for 33 patients post-treatment. Patients who did not respond to therapy are colored in red (non-responder) and patients who responded are colored in blue (responder). Lines connect data available for paired samples. Empirical Bayes moderated t-test was used to calculate statistically significant differences between baseline and post-treatment groups as described in the Methods section (adjusted p-value = 0.026). (E-F) (E) A375 and (F) SK-MEL-2 melanoma cells were transfected with empty vector (EV) or ULK1 expression plasmid (ULK1 OE). The next day, transfected cells were either left untreated or were treated with IFNγ (2500 IU/mL) for 6 hours and then processed for qRT-PCR analysis. Scatter dot plots show fold change of mRNA expression for the indicated genes over untreated EV-transfected cells (control). Means ± SEM from three independent experiments are shown. Statistical analyses were performed using one-way ANOVA followed by Tukey’s multiple comparisons test. *, p < 0.05, ***, p < 0.001.

