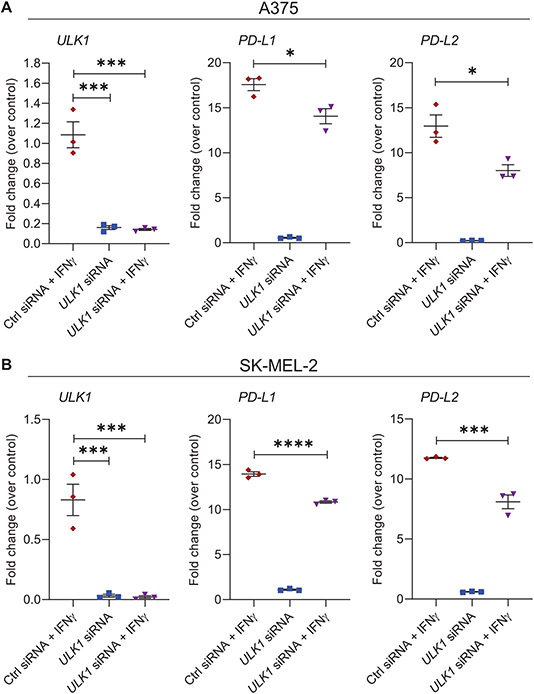
Figure 2. Gene-targeted inhibition of ULK1 reduces transcription of IFNγ-induced immunosuppressive genes in melanoma cells.
(A-B) qRT-PCR analysis of ULK1, PD-L1 and PD-L2 mRNA expression in control (Ctrl) siRNA or ULK1 siRNA-transfected (A) A375 and (B) SK-MEL-2 melanoma cells, either left untreated or treated with IFNγ (2500 IU/mL) for 6 hours. Scatter dot plots, with means ± SEM from three independent experiments, show fold change of mRNA expression for each gene compared to Ctrl siRNA-transfected untreated cells (control) for each independent experiment. Statistical analyses were performed using one-way ANOVA followed by Tukey’s multiple comparisons test. *, p < 0.05, ***, p < 0.001, ****, p < 0.0001.

