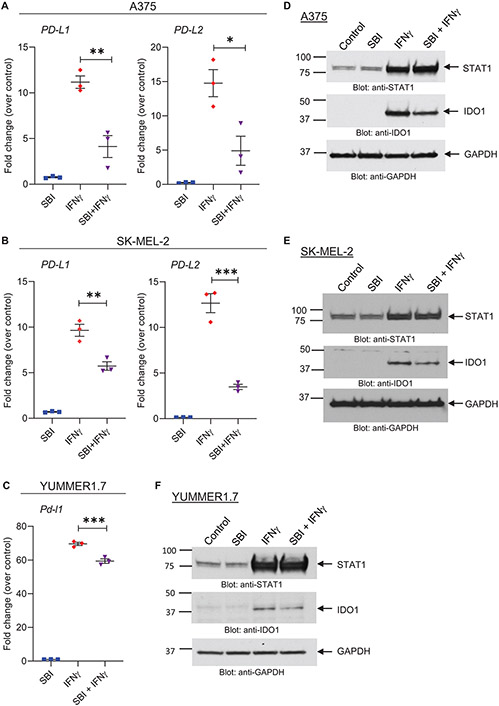
Figure 3. Pharmacological inhibition of ULK1 activity reduces transcription of IFNγ-induced immunosuppressive genes in melanoma cells.
(A-C) qRT-PCR analysis of PD-L1 and PD-L2 mRNA expression in (A) A375 and (B) SK-MEL-2 and of Pd-l1 in (C) YUMMER1.7 cells treated with either vehicle (DMSO, control), the ULK kinase inhibitor SBI-0206965 (SBI) (10 μM), IFNγ (2500 IU/mL) or combination therapy with SBI-0206965 and IFNγ (SBI + IFNγ) for 6 hours. Scatter dot plots, with means ± SEM from three independent experiments, show fold change of mRNA expression for each gene compared to vehicle-treated cells (control) for each independent experiment. Statistical analyses were performed using one-way ANOVA followed by Tukey’s multiple comparisons test. *, p < 0.05, **, p < 0.01, ***, p < 0.001. (D-F) Immunoblotting analysis of STAT1 and IDO1 in (D) A375, (E) SK-MEL-2 and (F) YUMMER1.7 cells treated with either vehicle (DMSO, control), the ULK kinase inhibitor SBI-0206965 (SBI) (A375: 10μM, SK-MEL-2: 5μM, YUMMER1.7: 1μM), IFNγ (1000 IU/mL) or combination therapy with SBI-0206965 and IFNγ (SBI + IFNγ) for 24 hours. GAPDH expression was used as loading control. Immunoblots shown are representative of three independent experiments.

