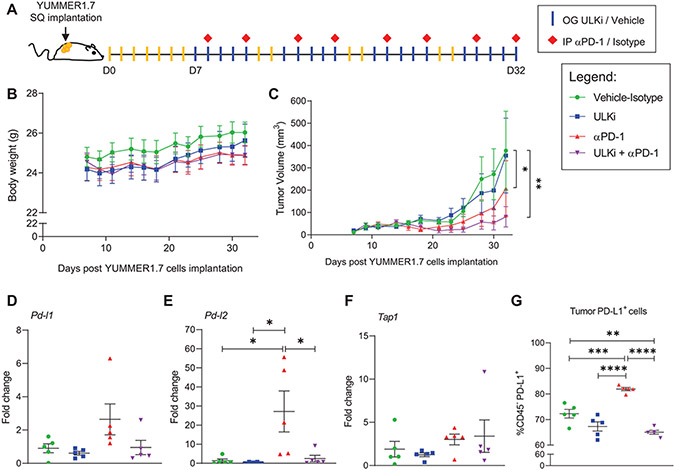
Figure 5. Drug-targeted inhibition of ULK1 decreases expression of anti-PD-1 therapy-driven IFNγ-induced immunosuppressive genes in an in vivo mouse melanoma model.
(A) Schematic illustration of YUMMER1.7 mouse melanoma in vivo model and therapeutic regimen. Seven days (D7) post subcutaneous (SQ) implantation of YUMMER1.7 mouse melanoma cells into C57BL/6J mice, mice were randomized by tumor size into four treatment groups: 1- Vehicle-Isotype, 2- ULK inhibitor (ULKi), 3- anti-PD-1 (αPD-1) and 4- ULKi + αPD-1. Mice were treated by oral gavage (OG) with either SBP-7455 (ULKi) (10 mg/kg) or its vehicle five times per week and by intraperitoneal injection (IP) with either anti-PD-1 antibody or isotype control antibody (10 mg/kg) twice per week for four weeks, as illustrated. (B) Mice body weight was monitored three times per week throughout the study. Data shown are means ± SEM (n = 6 for vehicle-isotype and ULKi, n = 7 for αPD-1 and ULKi + αPD-1 treatment groups). (C) Tumor volume was measured three times per week throughout the study. Data shown are means ± SEM (n = 6 for vehicle-isotype and ULKi, n = 7 for αPD-1 and ULKi + αPD-1 treatment groups). A linear mixed effects model was fitted with ln(volume) as the outcome and day, treatment group and their interaction as fixed effects. For 0 volume measurements, ln(1) was used. Within-mouse correlation between repeated measurements was modeled using autoregressive order 1 (AR(1)) covariance structure. Pairwise differences between groups at Day 32 were assessed based on the model, and p-values were adjusted for multiple comparisons using the method of Tukey-Kramer. Analyses were done using PROC MIXED in SAS v 9.4 software (26). *, p < 0.05 between vehicle-control and αPD-1 and **, p < 0.01 between vehicle-control and ULKi + αPD-1 treatment groups. p < 0.05 was observed between ULKi and αPD-1 and ULKi + αPD-1 treatment groups. See also Supplementary Fig. S6. (B-C) Results are representative of two independent in vivo studies. (D-G) YUMMER1.7 tumor-bearing mice were treated as illustrated in A, and, on day 35, mice were treated once by oral gavage with either ULKi (10 mg/kg) or its vehicle and tumors were collected 24 hours later. (D-F) qRT-PCR analysis of Pd-l1, Pd-l2 and Tap1 mRNA expression in YUMMER1.7 tumors isolated from mice treated with either vehicle-isotype, ULKi, αPD-1 or ULKi + αPD-1. Scatter dot plots, with means ± SEM (n = 5 for each treatment group), show fold change of mRNA expression for each gene compared to a randomly selected vehicle-isotype-treated mouse tumor. Statistical analyses were performed using one-way ANOVA followed by Tukey’s multiple comparisons test. *, p < 0.05. (G) Scatter dot plot shows the percentage of tumor cells expressing PD-L1 (CD45− PD-L1+ cells) in tumors isolated from vehicle-isotype, ULKi, αPD-1 and ULKi plus αPD-1-treated mice with means ± SEM (n = 5 for each treatment group). Data were assessed by flow cytometry and the gating strategy used is shown in Supplementary Fig. S17. Statistical analyses were performed using one-way ANOVA followed by Tukey’s multiple comparisons test. **, p < 0.01; ***, p < 0.001 and ****, p < 0.0001.

