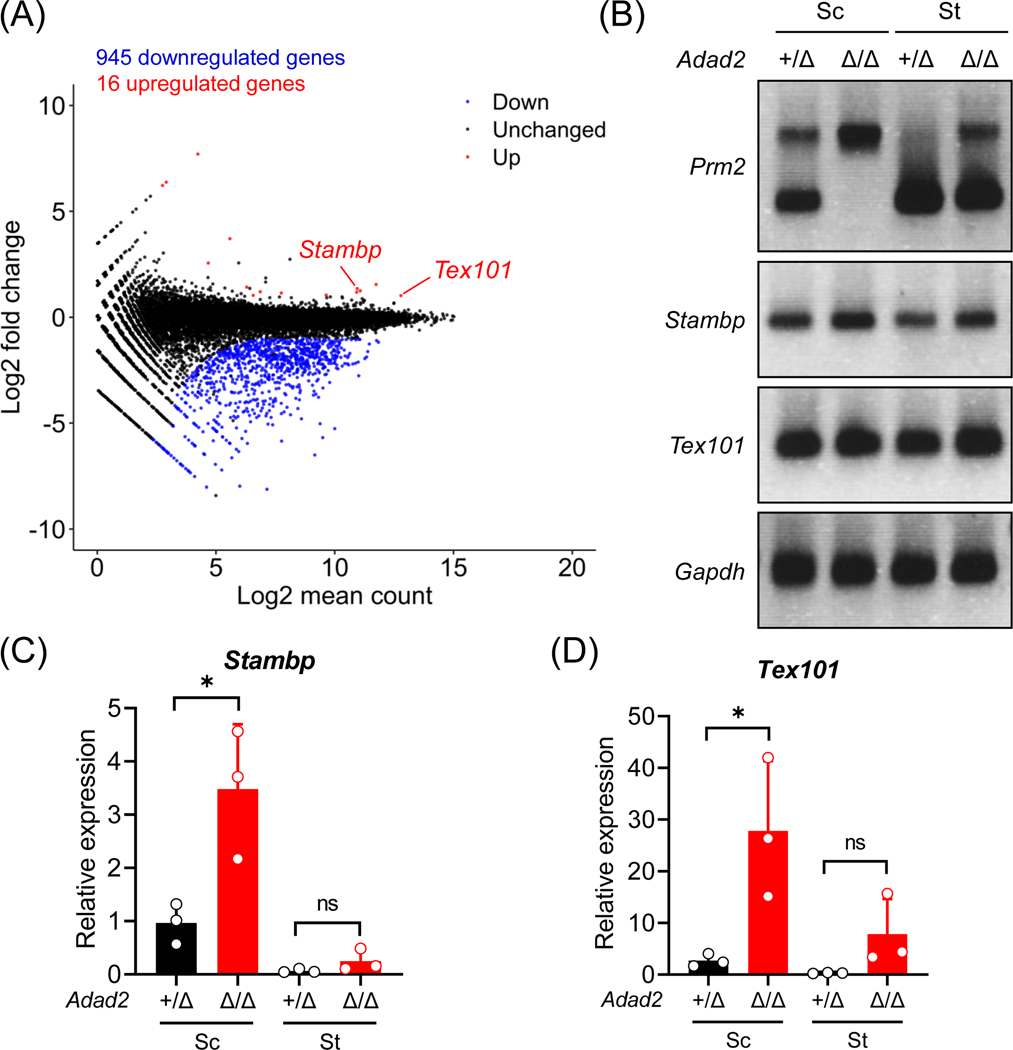
Figure 3. Ablation of ADAD2 causes dramatic transcriptomic changes in the male germline.
(A) An MA plot depicting differentially expressed genes in the testes from wildtype and Adad2Δ/Δ male mice at 24 days postpartum. Each dot represents one gene; the x-axis and y-axis denotes the log2 value of mean expression level and fold change, respectively. Black, red, and blue indicates no significant difference, significant upregulation, and significant downregulation (more than 2-fold change), respectively. (B) RT-PCR analyses of Prm2, Stambp, and Tex101 in the spermatocytes (Sc) and spermatids (St) from Adad2+/Δ and Adad2Δ/Δ male mice. Gapdh was analyzed in parallel as a loading control. (C – D) RT-qPCR analyses of Stambp and Tex101 in the spermatocytes (Sc) and spermatids (St) from Adad2+/Δ and Adad2Δ/Δ male mice.

