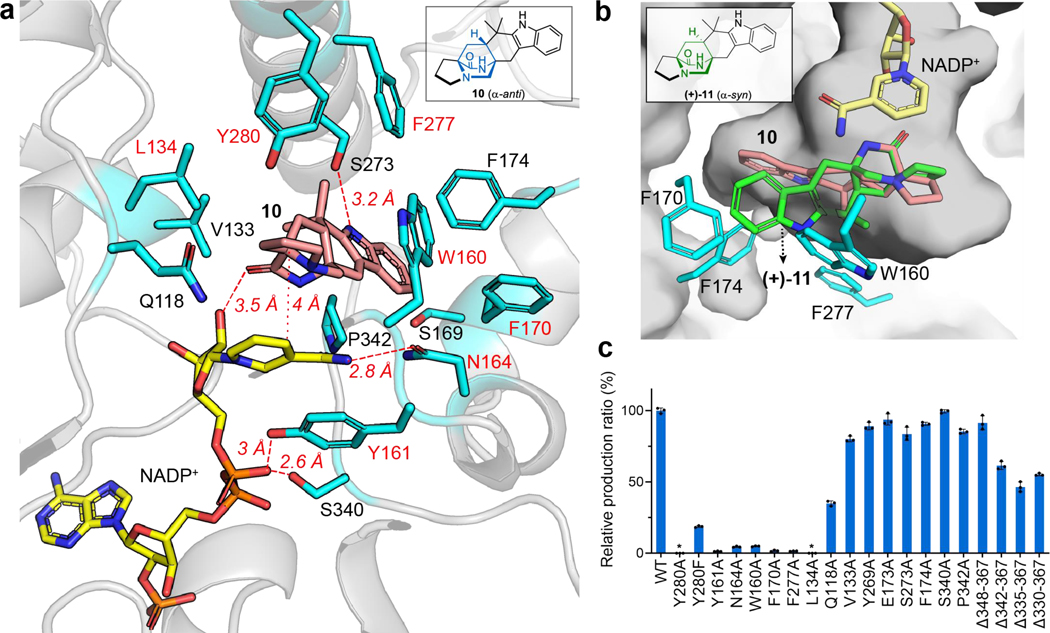
Fig. 3 |. CtdP active site view and mutagenesis study.
a, Active site of CtdP. The CtdP residues are shown in blue, while NADP+ and 10 are shown in yellow and salmon, respectively. b, Superposition of the common bicyclo[2.2.2]diazaoctane ring in (+)-11 (green) with that in 10 (salmon) in CtdP-NADP+−10 complex. c, Analysis of the formation of 10 with CtdP mutants relative to wild-type (WT) production. Data represents as mean ± s.d. from triplicate independent experiments (n = 3). The relative ratio of product 2 formation in the mutant compared to the WT CtdP is based on the peak area of UV at 280 nm.

