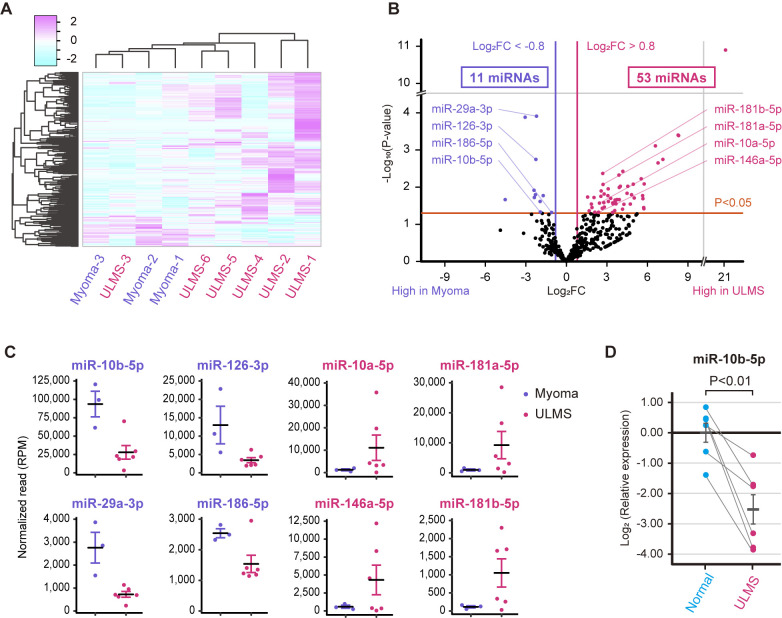
Figure 1.
miRNA profiles of ULMS and myoma. (A) Hierarchical clustering and heatmap analysis showing 334 differentially expressed miRNAs between the ULMS and myoma samples. The differentially expressed miRNAs were defined as an absolute log2 FC >0.8. (B) Volcano plot between ULMS and myoma samples. The P-values for each miRNA were calculated using the Wald test in DESeq2. (C) Normalized reads of miR-10b-5p, miR-29a-3p, miR-126-3p, miR-186-5p, miR-10a-5p, miR-146a-5p, miR-181a-5p and miR-181b-5p. (D) Relative expression levels of miR-10b-5p in paired ULMS and myometrium samples. The relative expression was compared using paired Student's t-test. Error bars represent standard errors of the mean. FC, fold change; miR/miRNA, microRNA; RPM, reads per million; ULMS, uterine leiomyosarcoma.

