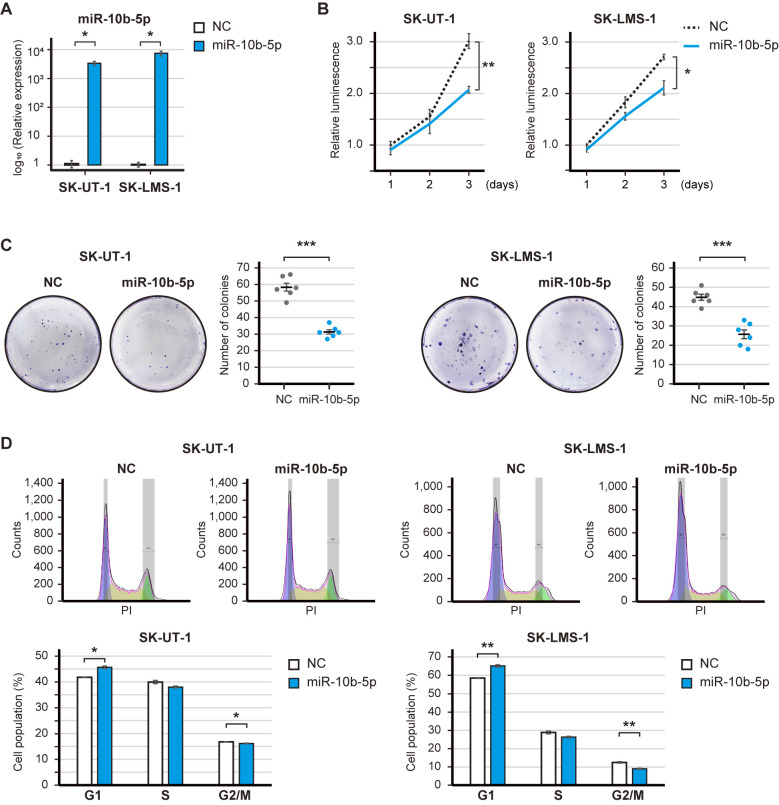
Figure 2.
Effect of miR-10b-5p overexpression on leiomyosarcoma-derived cell lines. (A) Validation of miR-10b-5p overexpression following transfection with 20 nM miR-10b-5p mimics. (B) Proliferation of miR-10b-5p transfected cells. Cell proliferation was measured at 24, 48 and 72 h, and the luminescence was compared using Welch's t-test. (C) Representative images and bar graphs of the clonogenic assay. Transfected cells were seeded in 6-well plates (300 cells/well) and incubated for 6 days, and the number of colonies was compared using Welch's t-test. (D) Cell-cycle distribution of miR-10b-5p-transfected cells. Cell-cycle distribution was calculated by FlowJo, and the cell percentage was compared using Welch's t-test. Error bars represent the standard errors of the mean. *P<0.05, **P<0.01 and ***P<0.001. miR, microRNA; NC, negative control.

