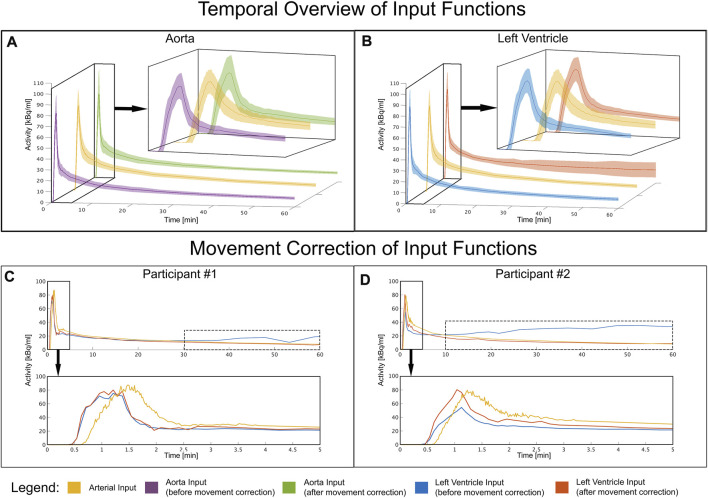
FIGURE 3.
Temporal overview of each input function: (A) Mean and standard deviation time course of the image derived input function before and after movement correction in comparison to the arterial input function of all participants. The aorta shows a stable and concurrent input function compared to arterial blood both before and after movement correction. (B) Mean and standard deviation time course extracted from the left ventricle for all participants (C–D) Shows the input functions of two participants affected by movement problems. Towards the end of the measurement, the variance increases due to movement which is indicated by the dotted box. This was corrected by applying movement correction. Time course extracted from the left ventricle of two very movement intense participants and how motion correction counters these effects, to better match the arterial input function.

