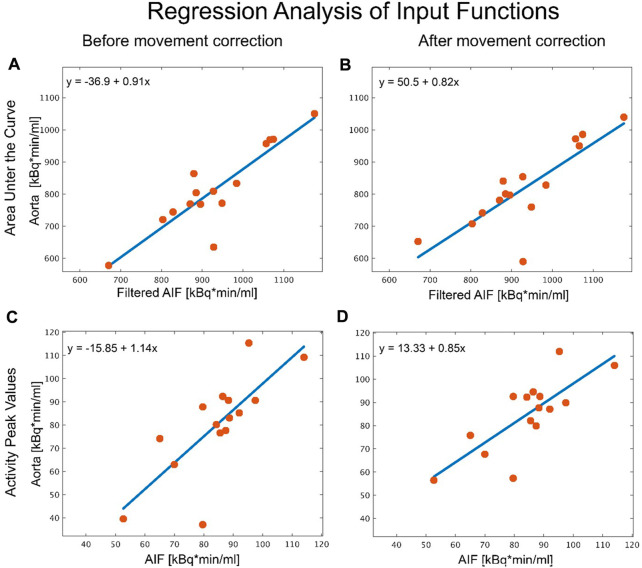
FIGURE 4.
Analysis of the different aorta input functions. Regression analysis comparing peak values and area under the curve (AUC) of the arterial input function (gold standard) to an image derived input function (IDIF) placed in the aorta before and after movement correction. (A) AUC analysis of the automatic vendor generated IDIF in the aorta before movement correction vs. the AIF. (B) AUC analysis of the manually placed volume of interest (VOI) in the aorta after movement correction vs. the AIF. (C) As in (A), regression analysis of peak values in the automatic vendor generated VOI vs. AIF before and (D) in the manually created VOI after correcting for movement vs. AIF. The source of the discrepancy between the IDIF and AIF method for the two outliers stem from misplaced VOIs when leading to discrepancies in the IDIF, where movement correction had no effect, due to it being incorrectly placed from the beginning.

