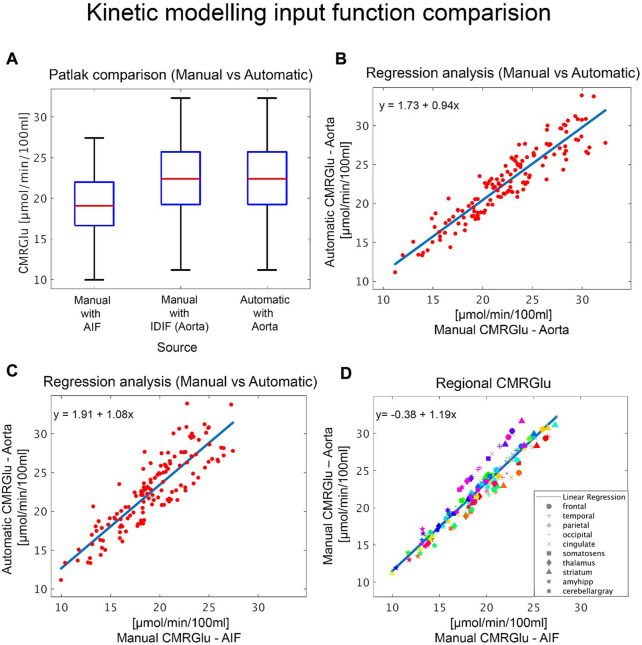
FIGURE 5.
Comparison of kinetic modelling outputs: Quantification of glucose metabolism with different input functions. (A) Boxplots show overall cerebral metabolic rate of glucose (CMRGlu) values for the different input functions modelled either manually or automatically via the vendor software. (B–C) Regression analyses comparing CMRGlu obtained from the automatically generated aorta IDIF with (B) those from the manual aorta IDIF definition, modelling and motion correction (P4) and (C) the AIF. Subplot (B–C) plots include values across all regions and subjects. (D) Regional CMRGlu uptake comparison between the AIF and IDIF(Aorta). Here the different colors represent each participant, and each symbol represents the regions of interest, listed in the legend.

