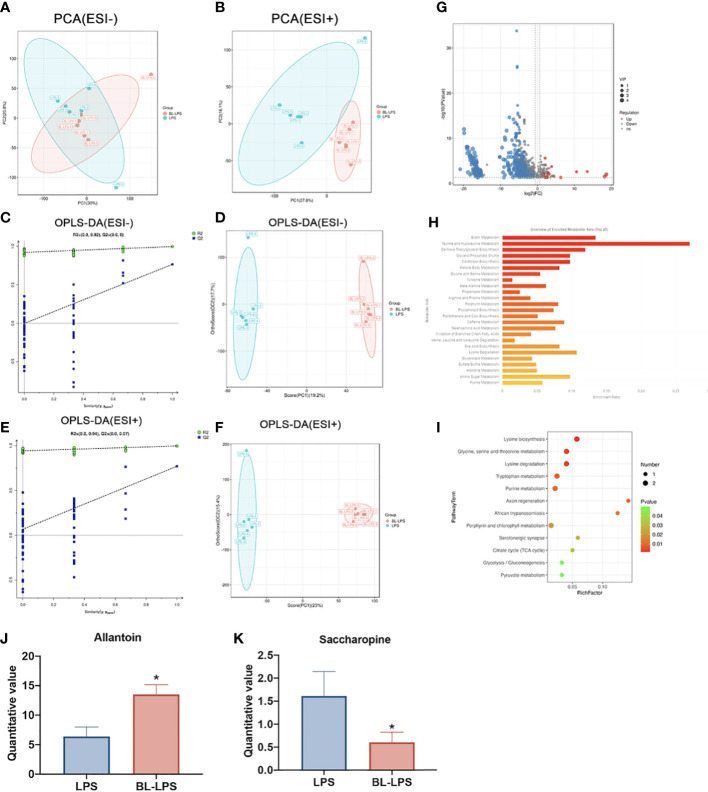
Figure 7.
Effects of B.licheniformis on metabolome composition of serum in weaned piglets challenged with LPS. (A, B) Principal component analysis (PCA) score plot of nontargeted metabolite profiling of the serum samples among the two groups in both negative (ESI-) and positive ionization modes (ESI+). (C) The corresponding validation plot based on 200 times permutation tests demonstrated the robustness of the OPLS-DA model in a negative mode. (D) The score plot of OPLS-DA in a negative mode. (E) The corresponding validation plot based on 200 times permutation tests demonstrated the robustness of the OPLS-DA model in a positive mode. (F) The score plot of OPLS-DA in a positive mode. (G) The volcano map analyzed the differential metabolites in the serum. (H) KEGG pathway classification. (I) Bubble diagram showing the KEGG enrichment analysis. The bubble size indicates enriched the numbers, while the color shade indicates the differences. (J, K) Analysis of the differential metabolites by one-way ANOVA and Tukey’s test. LPS, fed with the basal diet and injected with LPS, BL-LPS, fed with the basal diet supplemented with Bacillus licheniformis and injected with LPS. *Means significant difference (P < 0.05). Values are expressed as the mean ± SEM, n = 6.

