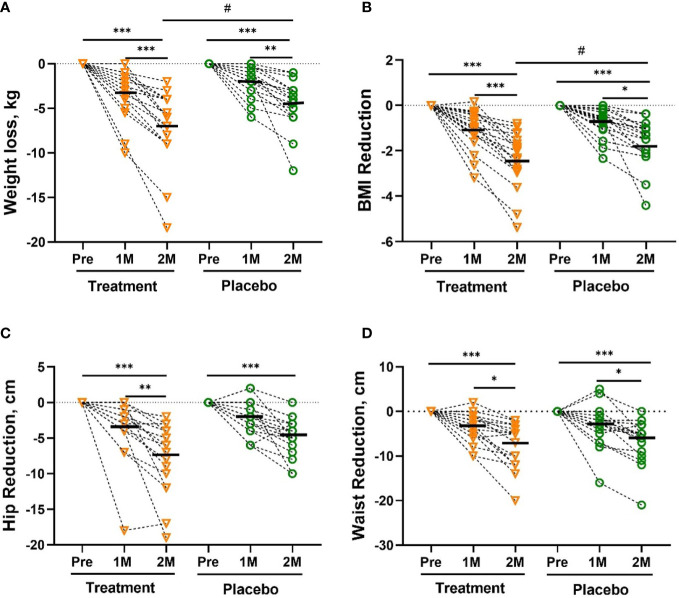
Figure 1.
The Reduction in body weight (A), BMI (B), hip circumference (C), waist circumference (D). The reduction in body weight was significantly greater in the treatment group than in the placebo group after 2 months (2M). Bars were shown as mean of each group. All intra-group analysis were performed by using one-way ANOVA followed by bonferroni post hoc, and all inter-group analysis for baseline and treatment effects were performed by using t test followed by Mann-Whitney (# represents p < 0.05) by Prism 9 software (*, ** and *** represent p < 0.05, p < 0.01 and p < 0.001). Body mass index, BMI.

