Figure 7.
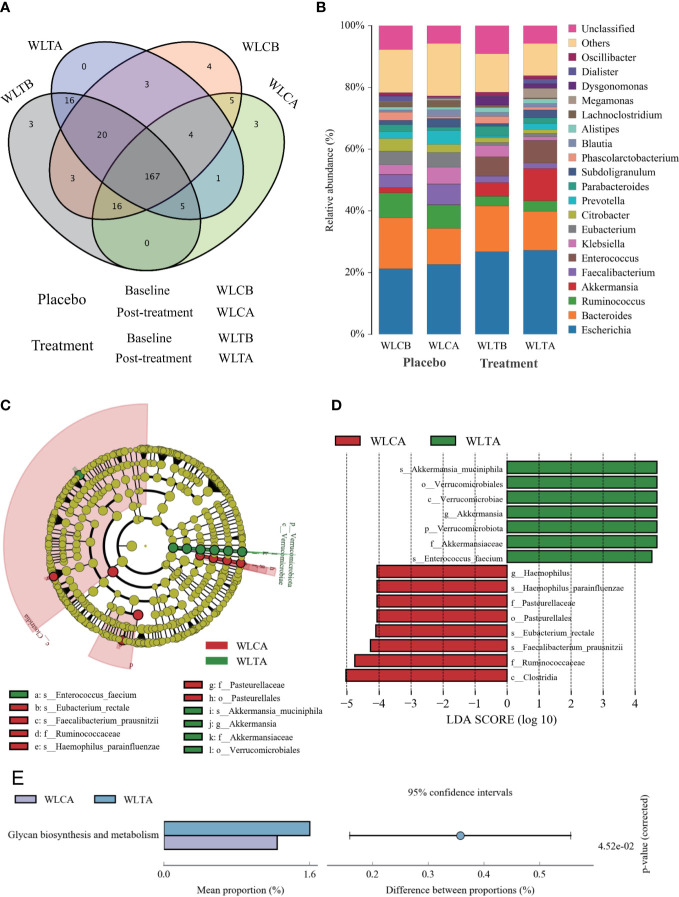
The structures and compositions of the gut microbiota before and after treatment in the two groups. (A) The Venn diagram of OTUs (species). (B) The composition of relative abundance on genus. (C) Phylogenetic cladogram of microbial lineage in fecal samples of treatment group and placebo group, with colors representing the most abundant differences in composition. (D) Key phylotypes of the gut microbiota responding to W-LHIT treatment. The histogram shows the lineage with LDA value of 4 or higher determined by LEFSe. (E) Key KEGG metabolic pathway responding to W-LHIT treatment.

