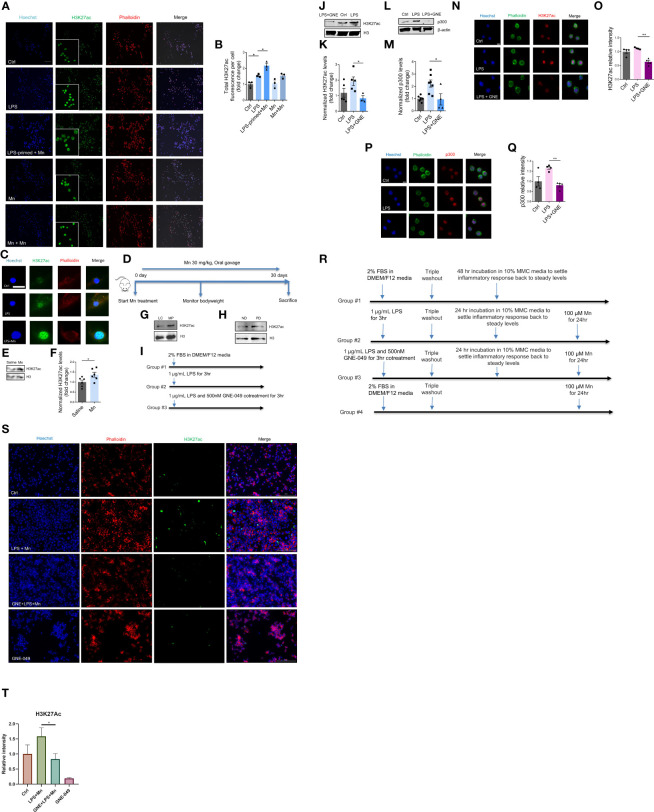
Figure 2.
H3K27ac deposition in microglial cells and mice in response to LPS priming and subsequent Mn exposure. (A) Representative ICC images of H3K27ac in MMCs primed with LPS and treated as indicated, with phalloidin-stained cytoplasm in red, Hoechst-stained nuclei in blue, and H3K27ac in green (n=3). Scale bar, 100 µm. (B) Immunofluorescence microscopy analyses of total H3K27ac intensity per cell. Calculation was automatically performed by Keyence microscope software. (C) Immunofluorescence microscopy analysis of H3K27ac in Mn-exposed, LPS-primed PMG cells. A single PMG cell is shown because of their low cell density resulting from their reduced viability during prolonged treatments. Scale bar, 10 µm. (D) Representative diagram of Mn treatment of C57BL/6J mice (n=6). (E) Representative Western blot and (F) densitometry assessing H3K27ac deposition in the striatum of Mn-exposed C57BL/6J mice (n=6), as a measure of Mn potential to promote H3K27ac deposition in vivo. Representative Western blots of increased H3K27ac deposition in the substantia nigra of (G) MitoParks and (H) postmortem human PD brains. ND, non-disease subjects; PD, PD patients. (I) Representative diagram of MMC treatment paradigm using GNE-049 to suppress memory formation by inhibiting LPS-induced deposition of epigenetic marks (results depicted in J–Q). (J) Representative Western blot and (K) densitometry assessing H3K27ac deposition in LPS treatment or LPS and GNE-049 co-treatment (n=3~5). GNE denotes GNE-049. (L, M) Representative Western blot and densitometry assessing of p300 deposition in LPS treatment and LPS with GNE-049 co-treatment (n=4~7). Immunofluorescence microscopy analyses of (N, O) H3K27ac and (P, Q) p300 in MMCs with treatments as indicated (n=4). Scale bar, 5 µm. (R) Representative diagram of MMC treatment paradigm to examine the effects of GNE-049 on H3K27ac upon a secondary Mn insult (S, T). (S, T) Representative immunofluorescence microscopy analysis of H3K27ac in Mn-exposed, LPS-primed MMCs cotreated with GNE-049 inhibitor. Scale bar, 100 µm. Data show mean ± SEM of one-way ANOVA followed by Tukey’s post hoc test. Ctrl, control; *p ≤ 0.05; **p<0.01.

