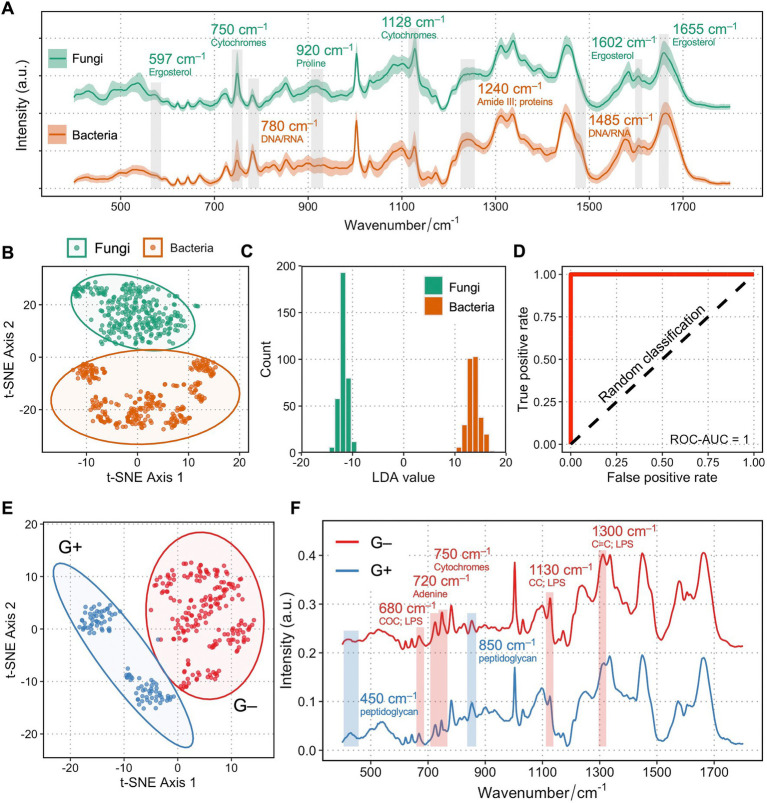
Figure 1.
Raman spectra of fungi and bacteria clearly differentiate between each other. (A) Averaged Raman spectra of 35 clinical isolates from 7 fungal species (n = 350) and 30 clinical isolates from 6 bacterial species (n = 300). Shaded area represents standard deviation from single-cell measurements. Biological assignments of Raman bands contributing mostly to the differentiation between bacteria and fungi are highlighted with either a higher band intensity in fungi (labeled as green) or in bacteria (labeled as tawny). (B) Unsupervised t-SNE visualization of fungi and bacteria based on their single-cell Raman spectra show two distinct clusters. (C) Histogram of LDA values of an LDA binary classification model. (D) ROC of the LDA model showing a ROC-AUC of 1. (E) Unsupervised t-SNE visualization of Gram-positive (blue) and Gram-negative (red) bacteria based on their single-cell Raman spectra show two distinct clusters. (F) Raman spectra of Gram-positive (blue) and Gram-negative (red) clearly differentiate between each other. Shaded area represents standard deviation from single-cell measurements. Biological assignments of Raman bands contributing mostly to the differentiation between two groups are highlighted with either a higher band intensity in Gram-positive (labeled as blue) or in Gram-negative bacteria (labeled as red).

