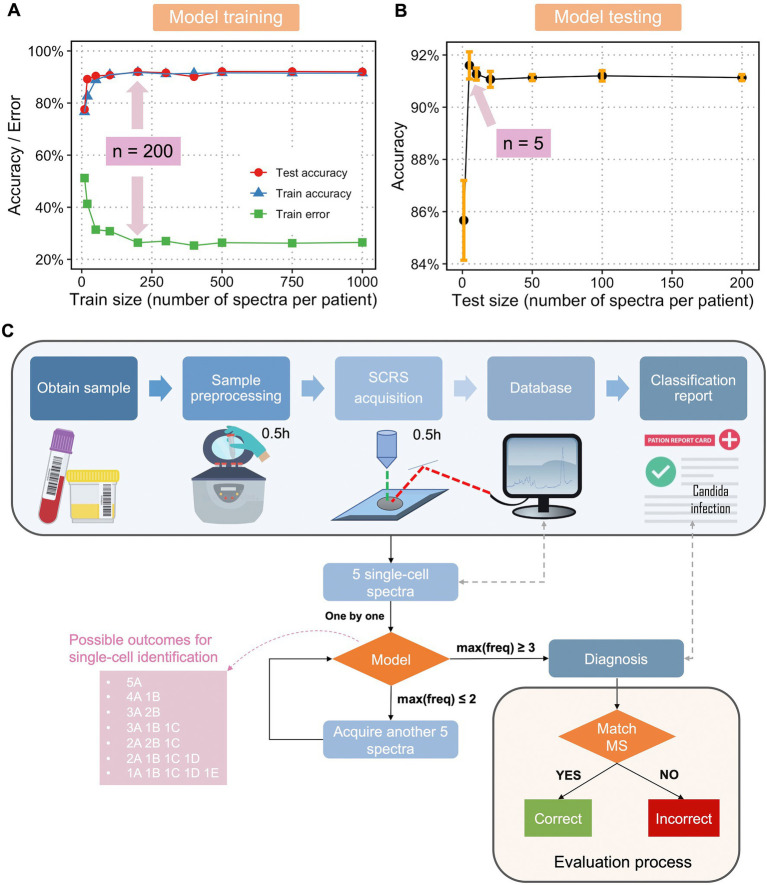
Figure 3.
Optimization and flowchart of diagnosis of fungal infection a single-cell Raman database, trained classification model, and optimization feedback loop. (A) Train size versus train accuracy, train error, and test accuracy and (B) test size versus test accuracy using single-cell Raman spectra of fungi and an LDA classification model. Sample size at the highest accuracy and/or lowest error was labelled. (C) Flowchart of a Raman-based diagnosis of clinical fungal infections. The pink box shows the seven possible outcomes for single-cell identification using 5 spectra per sample, with A, B, C, D, and E as hypothetical fungal species. Only when the maximum frequency of one class, max(freq) ≥ 3 (the first four scenarios in the pink box), a final diagnosis will be given. When the max(freq) < 3 (the last three scenarios in the pink box), another 5 spectra will be acquired. The process continues until max(freq) reaches 3 or more. The final diagnosis is compared with results from MALDI-ToF MS to evaluate the performance of the model and optimization loop.

