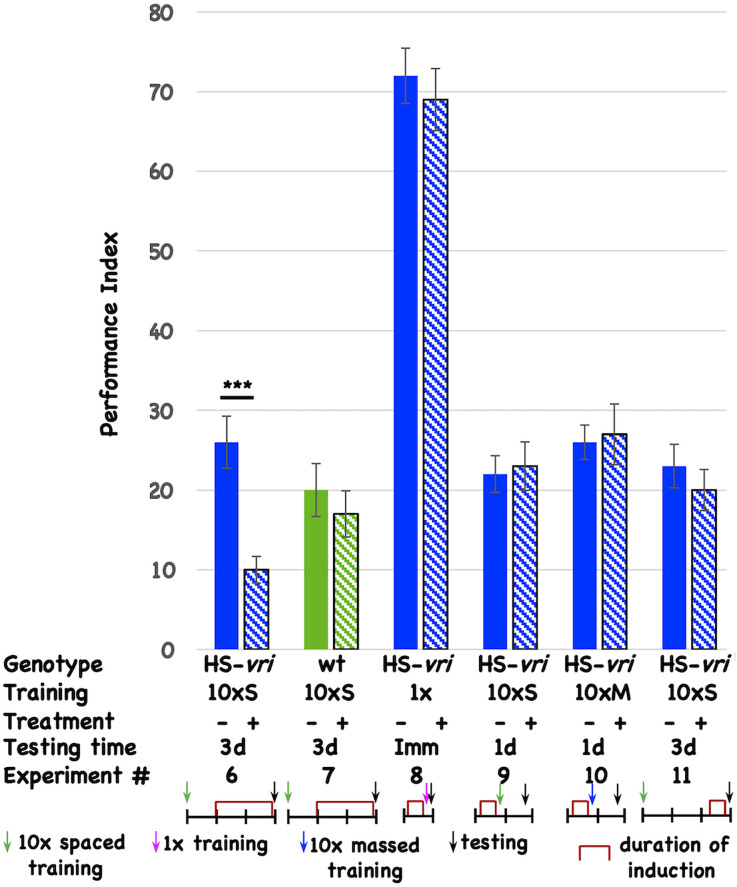
Figure 2.
Induction of vrille specifically disrupts 3d memory. The performance of flies is plotted as a function of genotype, type of behavioral training, treatment, and testing time. There are two genotypes of flies: HS-vri transgenic (histograms in blue or blue stripes) and otherwise isogenic “wild-type” (w1118, histograms in green or green stripes) flies in which the transgene resides. The performance of flies not induced is shown with solid histograms while that of flies that undergo heat-shock induction is shown in stripes. Underneath the behavioral data, the different experiments are assigned a number, and the details of each Experiment are shown in tabular and cartoon formats. In the table, the top line indicates the genotype of the flies that are used for each experiment. 10 × S indicates flies that receive 10 cycles of spaced training. 1x denotes flies that only undergo a single training trial. 10 × M corresponds to flies that receive 10 cycles of massed training. The — sign denotes no treatment, while the + sign shows data for flies that were induced with a mild, chronic heat-shock (20°C to 28°C shift). The different testing times are denoted as 3d (3-day memory), Imm (immediate performance after a single cycle of training), or 1d (24 h memory). In the cartoon portion of the Figure, the horizontal line denotes the timeline of the experiment, and each vertical tick mark represents 1d of elapsed time. Green, magenta, and blue arrows indicate whether flies received 10 cycles of spaced training, a single cycle of training, or 10 cycles of massed training. The black arrows indicate the time of testing. The red brackets show when the heat-shock induction occurred. The color scheme used for the data histograms (top of Figure) is unrelated to the one used in the cartoons (bottom part of Figure). N = 8 for all experiments, T-tests were used to evaluate significance. ***p < 0.001. All unmarked pairwise comparisons are not significantly different.

