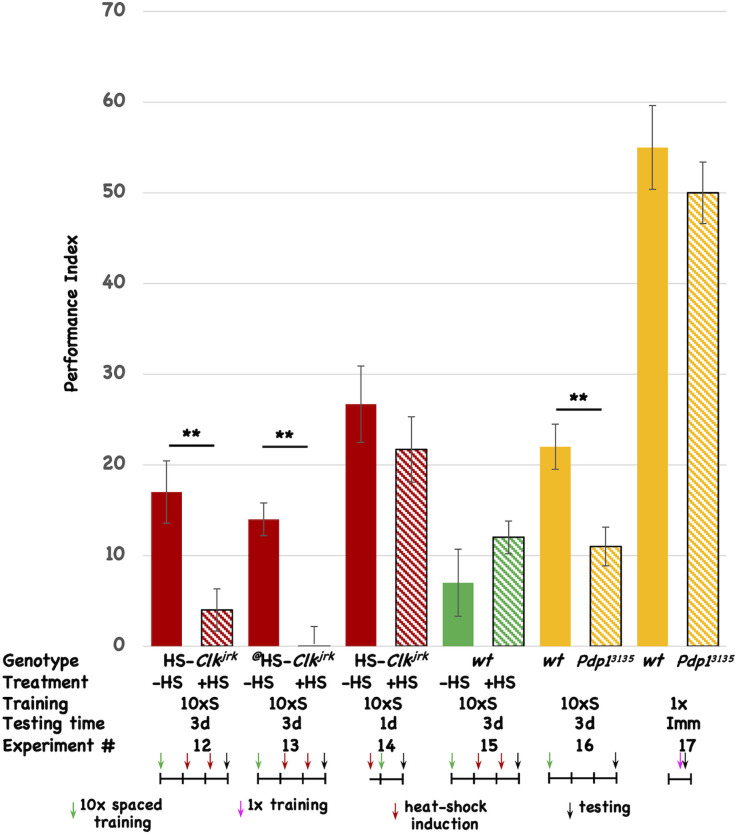
Figure 3.
Disruption of other circadian genes also interferes with 3d memory. The performance of flies is plotted as a function of genotype, treatment, type of behavioral training, and testing time. Colored histograms (solid or striped) show the performance of HS-Clkjrk (red), w1118 (green), or iso31 (wt), and the Pdp1ε3135 mutation (orange) that resides in the iso31 background. The @ symbol denotes a second, independent insertion of the HS-Clkjrk transgene. Solid colors represent the performance of uninduced (red and green) or wild type (orange; iso31) stocks. Striped histograms show the performance of the induced (red and green) or mutant lines (orange stripes). In the table, the last line is the Experiment #. The genotypes are shown in the top line, followed by whether heat-shock (+) or not was given to the flies. 10 × S corresponds to 10 cycles of spaced training, and 1x indicates flies that received only a single training trial. The testing times were immediate (Imm), 1d, or 3d after the end of training. The horizontal line in the cartoon shows the experimental timeline, and each vertical tick mark represents 1d of elapsed time. Green and magenta arrows indicate whether flies received 10 cycles of spaced training or a single cycle of training. The red arrows show the timing of a heat-shock induction (20°C to 36°C shift for 30’ duration), while the black arrows indicate the time of testing. The color scheme used for the data histograms (top of Figure) is unrelated to the one used in the cartoons (bottom part of Figure). N = 8 for all experiments, T-tests were used to evaluate significance. **p < 0.01. All unmarked pairwise comparisons are not significantly different.

