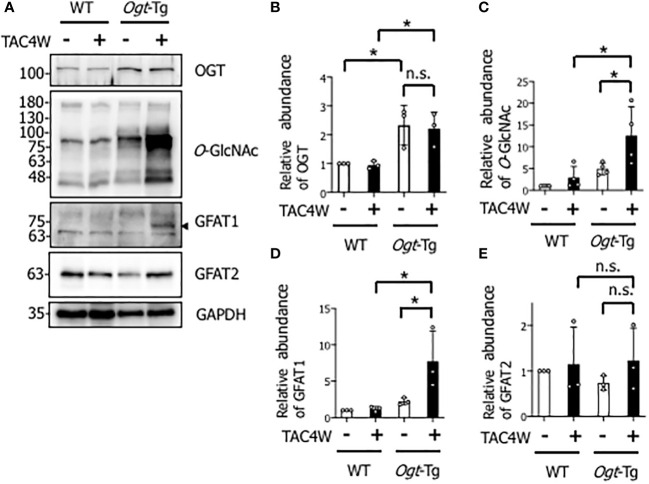
Figure 1.
Increased O-GlcNAcylation in the hearts of Ogt-Tg mice four weeks after TAC (TAC4W). (A) Western blot analysis for OGT, O-GlcNAc, GFAT1, and GFAT2 in heart tissues from WT and Ogt-Tg mice with or without TAC4W. Representative data was designated. (B–E) Quantifications of OGT, O-GlcNAc, GFAT1, and GFAT2 levels in (A) from 3 independent experiments using ImageJ software. The data were evaluated by two-way analysis of variance (ANOVA) followed by Tukey’s test. Values are shown as mean ± SD (*P<0.05). n.s., not significant; TAC, transverse aortic constriction; GFAT, glutamine-fructose-6-phosphate transaminase.

