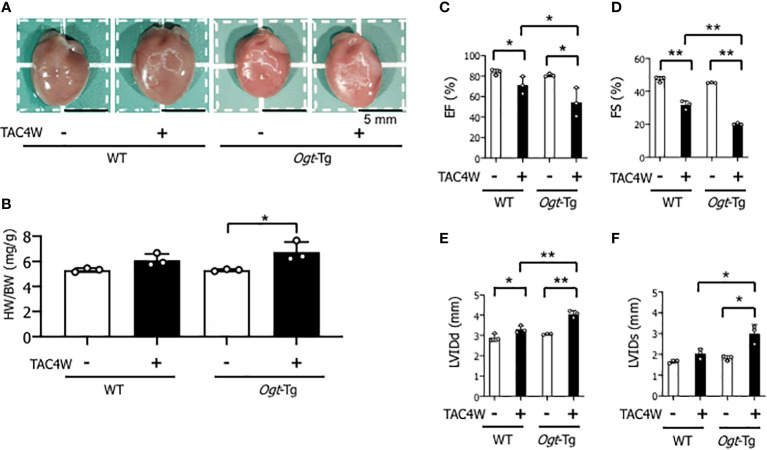
Figure 2.
Reduced cardiac function in Ogt-Tg mice after TAC4W. (A) Hearts of representative WT and Ogt-Tg mice after TAC4W. Scale bars, 5mm. (B) Heart weight/body weight ratio (HW/BW, in mg/g) in TAC-treated WT and Ogt-Tg mice. The data were analyzed using two-way analysis of variance (ANOVA) followed by Tukey’s test. Values are shown as the mean ± SD value (n=3). *P<0.05. (C–F) Echocardiographic parameters of the mice; (C) EF, ejection fraction, (D) FS, fractional shortening, (E) LVIDd, end-diastolic left ventricular (LV) internal dimension, (F) LVIDs, end-systolic LV internal dimension. The data were evaluated by two-way analysis of variance (ANOVA), followed by Tukey’s test. **p<0.01. *p<0.05. n.s., not significant.

