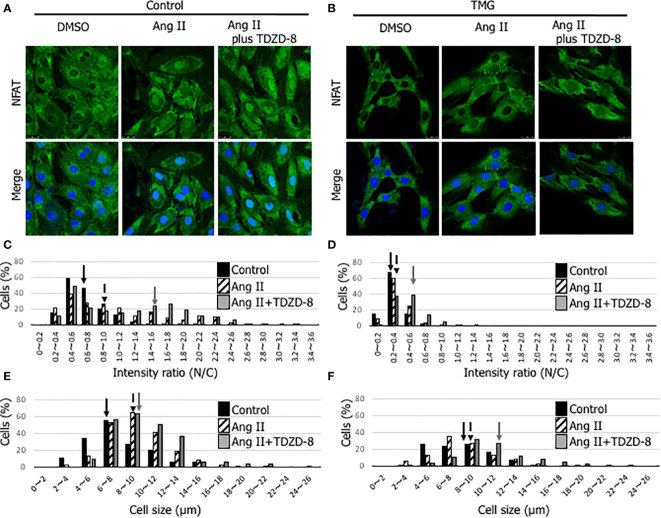
Figure 7.
Inactivation of the NFAT signaling pathway with TMG treatment and the restoration by the treatment of TDZD-8 in Ang II-stimulated H9c2 cells. (A, B) NFAT (green) and DAPI (blue) staining was performed to examine the effect of DMSO- (A) or TMG- (5 μM) (B) treatment with or without the pretreatment of TDZD-8 (2 μM) on angiotensin II (1 μM)-stimulated H9c2 cells. Representative data was designated. The cells were fixed with 4% PFA, and observed with confocal microscopy. Scale bar: 25 µm. (C, D) The nuclear/cytosol (N/C) ratio was calculated by ImageJ software to examine the effect of DMSO- (C) or TMG- (D) treatment with or without the pretreatment of TDZD-8 in Ang II-stimulated H9c2 cells, and designated in histogram. (E, F) The cell size was measured to examine the effect of DMSO- (E) or TMG- (F) treatment with or without the pretreatment of TDZD-8 in Ang II-stimulated H9c2 cells, and designated in histogram. Closed bar, Control cells; Hatched bar, Ang II-stimulated cells; Shaded bar, Ang II-stimulated cells with the pretreatment of TDZD-8. Arrows indicate median values of the distributions. TMG,Thiamet G; DMSO, Solvent control.

