
Fig. 2.
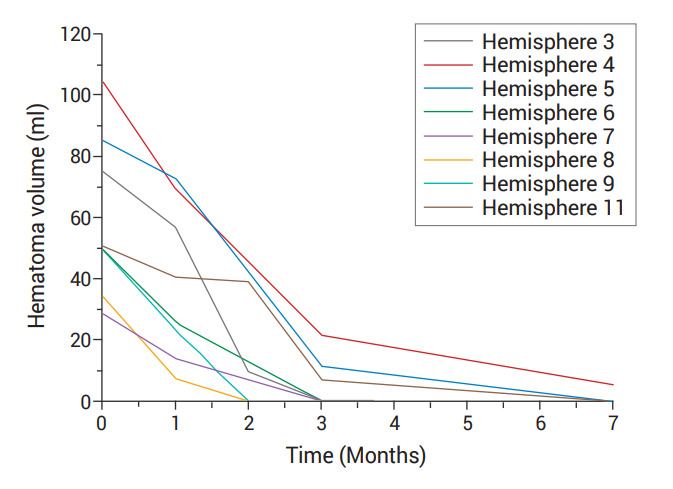
Pattern of volume reduction. This graph indicates changes in hematoma volume after performing MMAE in each patient who showed complete resorption. MMAE, middle meningeal artery embolization
Official websites use .gov
A
.gov website belongs to an official
government organization in the United States.
Secure .gov websites use HTTPS
A lock (
) or https:// means you've safely
connected to the .gov website. Share sensitive
information only on official, secure websites.
Pattern of volume reduction. This graph indicates changes in hematoma volume after performing MMAE in each patient who showed complete resorption. MMAE, middle meningeal artery embolization