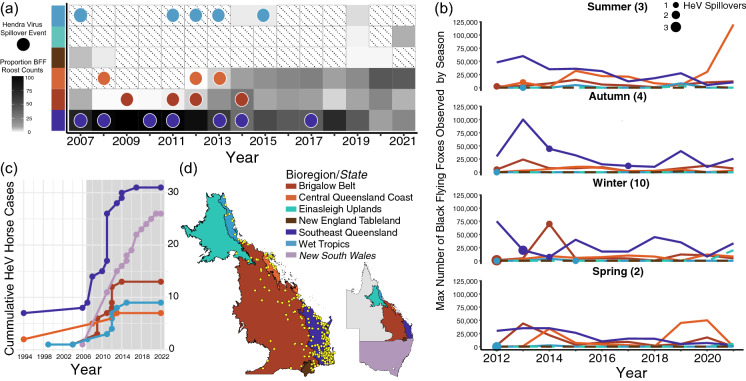
Fig. 5.
Observed Black Flying Fox Populations in the National Flying Fox Monitoring Program by Bioregion and Hendra Virus Spillovers. a Proportion of observed black flying fox roost counts seen in each bioregion from 2007 to 2021 with darker shades of grey representing a greater percentage of the total observed population, hatched cells representing no survey data, and circles denoting year and bioregion of HeV spillover events. b Number of black flying foxes observed in each bioregion by season since 2012. Filled circles represent the year and number of Hendra virus spillover events; size of circles corresponds to the number of confirmed horse cases. c Cumulative number of Hendra virus horse cases in each bioregion and state of New South Wales since detection with the grey box denoting the period shown in (a). d Bioregions of interest with roosts occupied by black flying foxes in winter as yellow dots; inset map of eastern Australia shows Queensland’s bioregions of interest and the state of New South Wales

