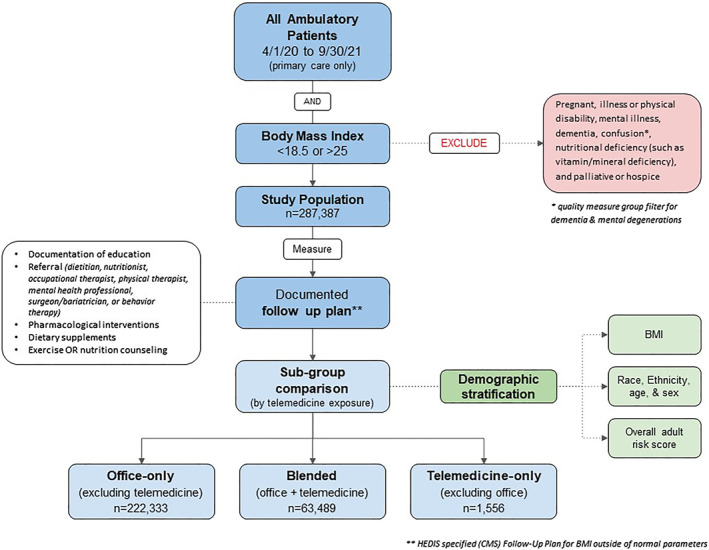
FIGURE 1.

This Hierarchical data filter schema (built in EPIC SlicerDicer tool) served as inclusion and exclusion criteria according to the HEDIS measure specification for abnormal BMI screening. A primary population filter served as the inclusion criteria: all patients seen in the primary care service line (throughout the health system) during the study timeframe who had a documented weight (to populate a BMI). As indicated in the figure, patients with a disqualifying diagnosis were excluded prior to measuring the percent of patients with qualifying follow up plans (which served as the quality performance numerator). Thus, quality performance was the total number of patients meeting inclusion criteria divided by the number of those patients with a documented follow up plan. This same approach was completed for each of the sub‐group comparisons, where an additional primary data filter for encounter type (office only, blended, or telemedicine‐only) was applied to separate patients by visit type. This separation of patients by visit type also facilitated a demographic comparison between sub‐groups (Race/Ethnicity, age/sex, BMI and patient risk score).
