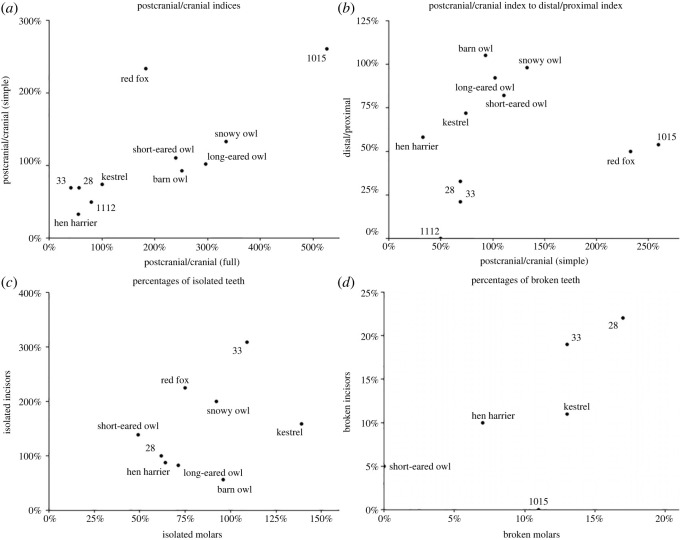
Figure 2.
Comparisons between three indices regarding proportions between different anatomical regions (a) and (b), and ratios of isolated (c) and broken (d) teeth. See table 1 for indices explanation. Selection of species taken from [28], pp. 209–213, selected data enclosed in the electronic supplementary material, S1, References.

