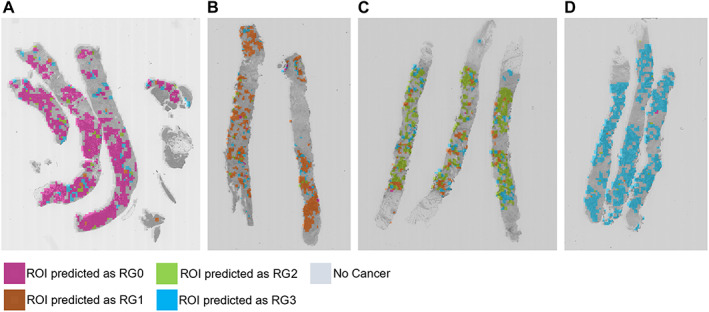
Figure 2.

Results of CNN prediction on representative cases. (A) Case #62 is predicted as RG0 by CNN model; 2,646 ROIs are predicted as RG0 among all 3,056 ROIs in the cancer areas, and their average likelihood score is 16.921, which is higher than other RG groups. (B) Case #12 is predicted as RG1 by CNN model; 1,860 ROIs are predicted as RG1 among all 2,317 ROIs in the cancer area, and their average likelihood score is 15.655, which is higher than other RG groups. (C) Case #10 is predicted as RG2 by CNN model; 1,511 ROIs are predicted as RG2 among all 2,208 ROIs in the cancer areas, and their average likelihood score is 17.123, which is higher than other RG groups. (D) Case #15 is predicted as RG3 by CNN model; 2,468 ROIs are predicted as RG3 among all 2,523 ROIs in cancer areas, and their average likelihood score is 24.058, which is higher than other RG groups. The details of the CNN analysis results of these cases are shown in supplementary material, Table S9.
